


Measures of Central Tendency
Measures of Central Tendency Application
Order Instructions:
see the attached files:
Application: Measures of Central Tendency
Measures of central tendency may be familiar to you from prior math classes you have taken. Consider the summary of these terms below:
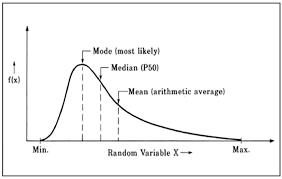
- The mean is the average of all numbers in a set of data.
- The mode is the number in a dataset that most frequently occurs.
- The median is the number that falls in the middle of the numbers in a given set when those numbers are placed in rank order.
- The standard deviation tells how far the numbers in a given data set deviate from the mean of that set. In other words, it tells whether the numbers in the dataset are generally close together or far apart.
These measures are simple but extremely valuable for all social scientists, including criminal justice researchers. They are summary statistics, which provide useful information about the study sample and allow researchers to compare multiple data sets. For this Application Assignment, use the following statistics: The total population of the Battawba metropolitan area was 5,604,383 persons in 2011. For that year, the following burglary rates were reported in the localities within this metropolitan area:
| Area | Number of Burglaries Reported |
| City of Battawba | 2,563 |
| City of Wineburg | 734 |
| City of Lakeville | 301 |
| City of Drake | 1,482 |
| City of Valmer | 231 |
| City of Chase Abbey | 857 |
| City of Southmetro | 644 |
| City of Collington | 1026 |
| City of Williamson | 644 |
| City of New Batten | 159 |
The assignment (2–3 pages):
- Calculate the mean, median, mode, and standard deviation for the burglary statistics provided on the metropolitan area of Battawba.
- Explain your interpretation of the measures of central tendency and standard deviation for burglary rates in the Battawba metropolitan area (i.e., what they can tell you about who is committing crime and where it is being committed).
Support your Application Assignment with specific references to all resources used in its preparation. You are to provide a reference list for all resources, including those in the Learning Resources for this course.
SAMPLE ANSWER
The mean of a distribution of values is obtained by adding all of the values and dividing the sum by the number (Nor n) of values. The mean score is the typical performance level of all the units sampled. The mean for the burglaries reported in Battawba metropolitan area is given as
= 864.1= 864 cases
This means that on average, 864 incidences of burglaries are reported with a standard deviation of 717 in the Battawba Metropolitan area with the city of Battawba, Wineburg, Drake,Chase Abbey, Southmetro, Collington Williamson experiencing the highest incidences.
The median represents the middle point of a distribution of data. It is the point at which exactly half of the observed values in the distribution are higher and half of the observed values are lower. The Median value for burglaries in Battawba metropolitan area is
MD=689 cases
This implies that 50% of Battawba metropolitan area has a lower than 689 cases of burglary report and 50% of Battawba metropolitan area has a higher than 689 cases of burglary report cases (Peavy, Dyal, Eddins, & Centers for Disease Control (U.S.), 1981).
The mode (Mo) is the simplest measure of central tendency and is easy to derive. The
Mode is observed rather than computed. The mode (Mo) of a distribution of values is the value
which occurs most often . The distribution of a given data can either be unimodal if it has only one mode or bimodal if it has two modes. Other distribution has more than two modes. For the case of burglaries in Battawba metropolitan area is, the mode is
Mode = 644 cases
This data has only one mode and its distribution can be said to be unimodal
This value implies that the number of burglary incidences that are frequently reported in Battawba metropolitan area is 644 cases and most of these are reported in the city of Southmetro and the city of Williamson. This cities are now our modal cities. These are the cities where most cases of burglary are frequently reported.
The standard deviation is given as Square root of variance (Grigg, & Transport and Road Research Laboratory, 1981)
Var (x) = 513689
Sd (x) = 716.721= 717
According to PL,Chebyshev (1821-1894), for any number k greater than 1, atleast (1-1/k2) of the measurements fall within standard deviation of the mean. That is within the interval (µ-ks, µ+ks)
Where µ is the mean of the sample or population and s is the variance of the sample data or population. For the case of burglaries in Battawba metropolitan area for k=1, that is one standard deviation, the interval is (147,1581). This indicates that about 100% of the burglary cases reported fall within one standard deviation, hence, there is less variations in the burglaries in the cities, except for the Battawba city which falls outside the interval. In conclusion, variation within the data is small. Most of the cases reported are concentrated around the mean
References
Peavy, J. V., Dyal, W. W., Eddins, D. L., & Centers for Disease Control (U.S.). (1981).Descriptive statistics: Measures of central tendency and dispersion. Atlanta, Ga: U.S. Dept. of Health and Human Services/Public Health Service, Centers for Disease Control.
Grigg, A. O., & Transport and Road Research Laboratory. (1981). Rating scales: Measures of central tendency and sample sizes. Crowthorne, Berkshire: Transport and Road Research Laboratory.
Bridges, J. (1961). Statistics for Selected Secondary-School Students. Education Digest, 27(3), 52-53.
We can write this or a similar paper for you! Simply fill the order form!
