


Dividend Growth Model
Order Instructions:
I will insite that the writer read the instructions about completing this papers with tables and appendix and strictly follow what APA requirements are when using tables and appendix. The prof is very particular about that as I mentioned in the last paper. The writer must number it and then reference it in the discussion. the writer must also strictly follow the template and complete the paper base on the template as I mentioned in the previous paper. Also remember that the template has all the subheadings and the writer just have to use them and fill in the information and the calculations and tables where necessary should be place in the appendix and reference in the summary. The writer must also include a reference page in APA that means they must all be in alphabetical order. the writer will adding this paper to 112912. Remember that I had send the template in the previous orders mentioned in this order hear, so the writer should refer to that.
Part three
Investment Analysis and Recommendation
• This part of the Investment Analysis and Recommendation Paper requires you to establish an estimated growth rate in earnings and dividends for your company. Note, in the dividend growth model, “g” is the growth rate for earnings AND dividends. You might want to check historical growth rates for the company (in terms of earnings and dividends). Also, many people rely on analyst forecasts. Be sure to justify your growth rate selection and explain how you arrived at the number. Assume your company is a constant growth stock. Use your estimated growth rate to solve for the required rate of return using the dividend discount model. After completing your calculations, respond to the following:
• Does the number you arrived at seem logical or feasible?
• Did you face any problems or issues using the dividend growth model? Does your company pay a dividend?
• Is it reasonable to assume constant growth for your company?
Write up a 2-page summary of your findings, including any calculations you made, and how you gathered your information.
SAMPLE ANSWER
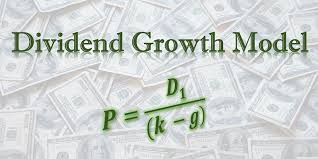
Dividend Growth Model
The dividend growth model helps in the in-depth understanding of equity by forecasting business performance and selecting the appropriate valuation model. Return on investment is a method that determines the efficiency of a company by dividing the returns and the cost of the investment (Isiklar, 2005). Just as its name suggests, retention ratio refers to the percentage of the net income that remains to grow the business after dividends have been paid. The price of stock is the cost at which an investor needs to undergo in purchasing securities in the exchange market. Earnings per share are the portion that indicates the company’s profitability as it indicates the monetary value of earnings per outstanding share of the company’s stocks.
The financial information used in these calculations was drawn from the income statement shown in Appendix A. Appendix B shows the dividend in stock for Chesapeake Energy Corporation of the year 2014. After calculating the net income of the company of 2014, the income is found to be $586,000 with an equity of 3. The total dividend of the company was $207.80 in the year 2014 with an outstanding share of $665.14. The total earnings of the company were $0.1952 in total. The dividends per shares that were offered by the company in 2014 were $2.32%, which is a good return to the company shareholders. The price of the company’s stock in 2014 was recorded as $15.06, which is also good news for the company shareholders. The calculations of the stock prices in relation to the ROE and retention ratio are shown in Appendix C. The following are formulas that have been used in the analysis that was carried out below:
The Rate of Return (ROE) = Net income/ Equity
Retention ratio = 1 – (cash dividends/ net income)
Growth rate in earnings (g) = Retention ratio x ROE
Dividend Discount Model (DDM) = Return rate (R)
= Dividend/ (Price of Stock) +g
Price of Stock = Dividend/ (Return Rate (R)-Growth Rate (g))
Issues with Using the Growth Model
Growth model by Chesapeake Energy Corporation brings issues as it relies much of the company growth rate model that assumes stable growth (Coe, 2002). This model demands that the Chesapeake Energy Corporation company stock is hypersensitive to the entire growth dividend rate that is provided that cannot exceed the cost of equity. The growth model brings along the issue of not taking into account non dividend factors that are inclusive of brand loyalty and customer retention in Chesapeake Energy Corporation.
Growth
The Reasonability of Constant Growth is tested through the use of discounted cash flow that resides in the very heart of any valuation that the company is geared to use in its operations (Gomes, 2010). The use of reasonability of constant growth ensures that understanding about any given value of the most important perception is given in the right way ever for the benefit of the company success. Therefore, it is necessary to assume a constant growth in the company.
Conclusion
The numbers arrived at using dividend growth model seen logical and feasible as can be evidenced in the appendix. However, the use of dividend growth model seems complex and cumbersome due to several calculations and steps involved. It is reasonable to assume a constant growth in a company provided all the necessary requirements are taken into consideration.
The Bullock Gold Mining Assignment
The estimates provided by Danto can be used by Alma to determine the revenue that is expected from the gold mine. The expense of opening the mine and the annual operating expenses is determined. Opening the mine will cost an initial capital of $750 million with a cash outflow of $75 million for 9 years. The expected cash flows from the mine for the 9 year period is represented by the table shown below.
Table 1. Summary Table
| Year | Cash flow $ (million) |
| 0 | -$750 |
| 1 | 130 |
| 2 | 180 |
| 3 | 190 |
| 4 | 245 |
| 5 | 205 |
| 6 | 155 |
| 7 | 135 |
| 8 | 95 |
| 9 | -75 |
Discussion
Payback Period
The payback period is the time taken by the investment to recoup the initial cash injected into the project. Lucrative projects have shorter payback period than the non-lucrative project that tends to have a long payback period. The calculation of the payback period of this case is summarized in the appendix E.
Net Present Value
The Net Present Value (NPV) involves the calculations of the percentage return rate, less the initial cash outlay. The NPV bigger than 1, implies that the project is lucrative and economically viable and is worth the risk (Griffin, 2009). On the other hand, the NPV value which is less than one implies that the investment is less lucrative since the returns will be less than the costs involved in the project (Cornett, Adair, & Nofsinger, 2013). In this case, the calculations of NPV are shown in appendix F.
Internal Rate of Returns (IRR)
In this case, a rate of 12% provides an IRR of $1,594,792,833. Since it can be discounted on both the higher and the lower rate, the project IRR higher than the discounting rate of returns is acceptable as shown in the Appendix G.
Modified Internal Rate of Return
The modified IRR operates on the principle that the positive cash flows are reinvented at the firm’s cost of capital and the firms’ financial cost are done with the initial capital outlay (Bragg, 2009). In this regard, the modified IRR stands out as the most precise way of determining the cost and profitability of an investment as can be seen in the appendix H (Cullen, & Broadbent, 2012).
Conclusion
The Bullock Gold Mining case can be analyzed by the use of Payback Period, NPV, IRR, and modified IRR. From the calculations in the appendix, all the above calculations show positive results to imply that the project is worth investing in. Therefore, the Ballock Gold mine is a viable project.
References
Bragg, S. (2009). Accounting Control Best Practices. Wiley
Cheasapeake Corp. (2015). Company Profile: Chesapeake Energy Corporation. MarketLine
Coe, P. J. (2002). Power issues when testing the Markov switching model with the sup likelihood ratio test using U.S. output. Empirical Economics, 27(2), 395-401 Financial Service Professionals. Journal of Financial Service Professionals. 74-82.
Cornett, M., Adair, T., & Nofsinger, J. (2013). M:Finance.McGraw-Hill/Irwin; 2 edition
Cullen, J., & Broadbent, M. (2012). Managing Financial Resources (CMI Diploma in Management Series). Routledge; 3 edition
Gomes, O. (2010). Consumer confidence, endogenous growth and endogenous cycles. Journal of Economic Studies, 37(4), 377-404
Griffin, M. (2009). MBA Fundamentals Accounting and Finance. Kaplan Publishing
Isiklar, G. (2005). Essays on macroeconomic forecasting (Order No. 3177045). Available from ABI/INFORM Complete. (305363178)
Appendix A
Income Statement for Chesapeake Energy Corporation (CHK)
Appendix B
| Chesapeake Energy Corporation | Year 2014 |
| Net income | $ 586,000 |
| Equity | $ 3 |
| Total dividends paid | $ 207.80 |
| Outstanding shares | $ 665.14M |
| Earnings per share (EPS) | $ 0.1952 |
| Dividends paid per share | $ 2.32% |
| Stock price as of _ Chesapeake Energy Corporation (CHK) | $ 15.06 |
Appendix C
| Analysis | Formula | Year 2014 |
| ROE | Net income/ Equity | $ 195333.3 |
| Retention ratio | 1 – (cash dividends/ net income) | $ 0.9996 |
| Growth rate in earnings (g) | Retention ratio x ROE | $ 195255.17 |
Appendix D
Dividend Discount Model (DDM) =
(2.32%/ 15.06) +195255.17
= 195255.32
2.32% / (195255.32-195255.17)
= $ 15.47
Appendix E
Payback Period represents the number of years before the project pays off
Year 0= -750
Year 1=-750 130= -620
Year 2=-750 130 180= – 440
Year 3= -750 130 180 190= -250
Year 4= -750 130 180 190 245= -5
Year 4= -750 130 180 190 245 205= 200
This gold mine project will pay off between the 4th and the 5th year
5/205= 0.0244
Appendix F and 12% rate
| Initial investment | ($750,000,000) |
| 1st year’s return | $130,000,000 |
| 2nd year’s return | $180,000,000 |
| 3rd year’s return | $190,000,000 |
| 4th year’s return | $245,000,000 |
| 5th year’s return | $205,000,000 |
| 6th year’s return | $155,000,000 |
| 7th year’s return | $135,000,000 |
| 8th year’s return | $95,000,000 |
| $1,594,792,883 |
Appendix G
IRR can be calculated as follows
| Description | Data | Data |
| initial investment | ($750,000,000) | ($750,000,000) |
| 1st years returns | $130,000,000 | $130,000,000 |
| 2nd years returns | $180,000,000 | $180,000,000 |
| 3rd year returns | $190,000,000 | $190,000,000 |
| 4th year returns | $245,000,000 | $245,000,000 |
| 5th year returns | $205,000,000 | $205,000,000 |
| 6th year returns | $155,000,000 | $155,000,000 |
| 7th year returns | $135,000,000 | $135,000,000 |
| 8th year returns | $95,000,000 | $95,000,000 |
| 16% | 14% |
Appendix H
Modified IRR can be calculated as follows
| Description | data | MIRR after 3 year | |
| initial investment | ($750,000,000) | 220% | |
| 1st years returns | $130,000,000 | MIRR After 7 years | |
| 2nd years returns | $180,000,000 | 613% | |
| 3rd year returns | $190,000,000 | ||
| 4th year returns | $245,000,000 | ||
| 5th year returns | $205,000,000 | ||
| 6th year returns | $155,000,000 | ||
| 7th year returns | $135,000,000 | ||
| 8th year returns | $95,000,000 |
We can write this or a similar paper for you! Simply fill the order form!
