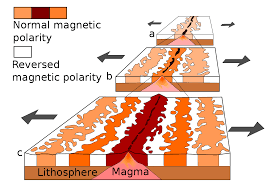
Paleomagnetism and the Ocean Floor
When Wegener proposed his hypothesis of continental drift, little was known about the ocean floor. He thought that the continents plowed through the ocean floor like ice breaking ships plowing through ice. Later studies of the oceans provided one of the keys to the plate tectonic theory. In this lab, you will observe how the magnetic rocks on the ocean floor can be used to understand plate tectonics.
Problem How are the paleomagnetic patterns on the ocean floor used to determine the rate of sea-floor spreading?
Materials
- pencil
- metric ruler
- calculator
- photocopy of diagrams
Skills Measuring, Interpreting Diagrams, Calculating
Procedure
- Scientists have reconstructed Earth’s magnetic polarity reversals over the past several million years. A record of these reversals is shown above. Periods of normal polarity, when a compass would have pointed north as it does today, are shown in color. Periods of reverse polarity are shown in white. Record the number of times Earth’s magnetic field has had reversed polarity in the last 4 million years.
- The three diagrams on the next page illustrate the magnetic polarity reversals across sections of the mid-ocean ridges in the Pacific, South Atlantic, and North Atlantic oceans. Periods of normal polarity are shown in color and match the colors in the illustration above. Observe that the patterns of polarity in the rock match on either side of the ridge for each ocean basin.
- On the photocopy of the three ocean-floor diagrams, identify and mark the periods of normal polarity with the letters a–f. Begin at the rift valley and label along both sides of each ridge. (Hint: The left side of the South Atlantic has already been done and can act as a guide.)
- Using the South Atlantic as an example, label the beginning of the normal polarity period c, “2 million years ago,” on the left sides of the Pacific and North Atlantic diagrams.
- Using the distance scale shown with the ocean floor diagrams, determine which ocean basin has spread the greatest distance during the last 2 million years. (Measure from the center of the rift valley.)
- Refer to the distance scale. Notice that the left side of the South Atlantic basin has spread approximately 39 kilometers from the center of the rift valley in 2 million years.
Analyze and Conclude
- Analyzing Data How many kilometers has the left side of the Pacific basin spread in 2 million years?
- Analyzing Data How many kilometers has the left side of the North Atlantic basin spread in 2 million years?
- Inferring How many kilometers has each ocean basin opened in the past 2 million years?
- Calculating If both the distance that each ocean basin has opened and the time it took to open that distance are known, the rate of sea-floor spreading can be calculated. Determine the rate of sea-floor spreading for the South Atlantic Ocean basin in centimeters per year. (Hint: To determine the rate of spreading in centimeters per year for each ocean basin, first convert the distance from kilometers to centimeters and then divide this distance by the time, 2 million years.)
- Calculating Determine the rate of sea-floor spreading for the North Atlantic and Pacific Ocean basins.
- Drawing Conclusions Which ocean basin is spreading the fastest? The slowest?
- Inferring Do ocean basins spread uniformly over the entire basin? Explain.
Use the library or the Internet to research the spreading rates for other divergent plate boundaries on Earth. Where is the fastest spreading rate? The slowest spreading rate?
We can write this or a similar paper for you! Simply fill the order form!


