


Cross Tabulation
Cross Tabulation Application Assignment
Order Instructions:
Application: Cross Tabulation
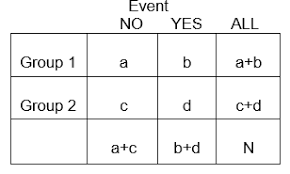
Variable relationships are very important in quantitative research. They tell researchers what effect different variables have upon one another. One of the easiest ways to display relationships between variables is through a cross-tabulation (cross-tab). A cross-tab is simply a chart that shows frequency or distribution of one or more variables for every category of another variable. Stated another way, a cross-tab is a joint frequency distribution of observations on two or more sets of variables. These statistical observations can be presented by numeric frequency, percentages, or both, depending on which is most useful given the specific data context.??For this Application Assignment, perform a cross-tabulation on the data provided in the handout “Week 10 Dataset” such that property crime is displayed as a rate per student population. Though Excel is not the only software that can be used to perform a cross-tabulation, it is used here because it is a widely available program. The handout entitled, “Cross-Tabulation in Excel” contains instructions on how to complete the task in Excel using two different methods.??The assignment (2–3 pages):
• Using Excel, perform a cross tabulation on the data provided in the Week 10 dataset.
• Explain what you can conclude from the output of the cross tabulation.
• Include your outputs in your Application Assignment document. (Copy and paste them from Excel into your Word doc.)
Support your Application Assignment with specific references to all resources used in its preparation. You are to provide a reference list for all resources, including those in the Learning Resources for this course.
Note: Please use the course text as one of the references for this assignment, AND the other articles on the attached files sent by email.
SAMPLE ANSWER
The Pivot table below, shows the total crimes and various categories of crimes committed in each college and totals for all the colleges. The information could help college authorities to know which crimes recur frequently.
| College | Sum of Crime Total | Sum of Forcible Rape | Sum of Aggravated Assault | Sum of Arson | Sum of Property Crime |
| Abalone University | 35 | 5 | 12 | 1 | 17 |
| Franklinville College | 4 | 0 | 2 | 0 | 2 |
| Marie Louis College | 14 | 2 | 4 | 0 | 8 |
| Robert Long College | 9 | 0 | 1 | 0 | 8 |
| Simon State | 42 | 3 | 5 | 1 | 33 |
| Grand Total | 104 | 10 | 24 | 2 | 68 |
Table I
(Jelen, 2010)
The pivot table below shows student enrolment and the number of crimes committed in each college
Table II
| College | Sum of Student enrolment | Sum of Crime Total |
| Abalone University | 10486 | 35 |
| Franklinville College | 989 | 4 |
| Marie Louis College | 2301 | 14 |
| Robert Long College | 3467 | 9 |
| Simon State | 20573 | 42 |
| Grand Total | 37816 | 104 |
(Jelen, 2010)
Table III
| College | Sum of Student Enrollment | Sum of Crime Total | Crime total as a percentage of student enrollment |
| Abalone University | 10486 | 35 | 0.33% |
| Franklinville College | 989 | 4 | 0.40% |
| Marie Louis College | 2301 | 14 | 0.61% |
| Robert Long College | 3467 | 9 | 0.26% |
| Simon State | 20573 | 42 | 0.20% |
| Grand Total | 37816 | 104 |
The pivot table below shows the grand totals of all the categories of crimes, crime totals and student enrolment arranged in a descending order
Table IV
| College | Sum of Student Enrolment | Sum of Crime Total | Sum of Forcible Rape | Sum of Aggravated Assault | Sum of Arson | Sum of Property Crime |
| Simon State | 20573 | 42 | 3 | 5 | 1 | 33 |
| Abalone University | 10486 | 35 | 5 | 12 | 1 | 17 |
| Robert Long College | 3467 | 9 | 0 | 1 | 0 | 8 |
| Marie Louis College | 2301 | 14 | 2 | 4 | 0 | 8 |
| Franklinville College | 989 | 4 | 0 | 2 | 0 | 2 |
| Grand Total | 37816 | 104 | 10 | 24 | 2 | 68 |
(Jelen, 2014)
The pivot table below indicates the various categories of crime totals, student enrolment, and various categories of crimes as a percentage of the grand total in each category.
Table V
| College | Sum of Student Enrollment | Sum of Crime Total | Sum of Forcible Rape | Sum of Aggravated Assault | Sum of Arson | Sum of Property Crime |
| Abalone University | 27.73% | 33.65% | 50.00% | 50.00% | 50.00% | 25.00% |
| Franklinville College | 2.62% | 3.85% | 0.00% | 8.33% | 0.00% | 2.94% |
| Marie Louis College | 6.08% | 13.46% | 20.00% | 16.67% | 0.00% | 11.76% |
| Robert Long College | 9.17% | 8.65% | 0.00% | 4.17% | 0.00% | 11.76% |
| Simon State | 54.40% | 40.38% | 30.00% | 20.83% | 50.00% | 48.53% |
| Grand Total | 100.00% | 100.00% | 100.00% | 100.00% | 100.00% | 100.00% |
(Jelen, 2010)
Report of findings
Table I above shows the total crimes committed in all the colleges which was 104 in total.It also shows the total number of crimes committed in each category of crimes. Table I shows that property crimes were higher than all other crimes at 64 followed by aggravated assault at 24, then forcible rape at 10. The least number of crimes committed at the colleges was arson at only 2 incidences. College administrators can therefore put in place measures to address property crimes which are likely to recur more frequently than the other categories of crimes. Table II shows the relationship between student enrollment and the number of crimes committed. From Table II, it can be observed that the higher the student enrolment the higher the numbers of crimes are committed. For example Simon State with a student enrolment of 20,573 recorded the highest number of crimes at 42 whereas Franklinville College with an enrolment of 989 had only 4 crime incidences. However, this information could be misleading judging by the percentage number of crimes per student enrolment as shown in Table III. Marie Louis College which had a student enrolment of 2301 has a higher percentage of crime occurrences at 0.61% as compared to Simon State which had 0.20% but with a higher student enrollment of 20,573. Franklinville College has a crime incidence ratio of 0.40% to student enrollment. If the same ratio at Franklinville College and Marie Louis College was applied to Simon State, then Simon State would have recorded higher crime incidences than the 42 incidences recorded. The problem of crime is more severe in Marie Louis College than in the colleges with higher enrollment.
Table IV shows the college arranged in an ascending order depending on the crime rates and student enrolment. At the top of the table is Simon State which had the highest number of student enrolment and the highest incidences of crimes followed by Abalone University and so on. The last college is Franklinville College which had the least student enrolment and the least number of crimes recorded. Table V presents the percentage number of crimes, student enrolment and various categories as a total for each category. From the table Simon State had the highest number of student enrolment at 54.40% whereas Franklinville College had the least at 2.62%. Simon State also recorded the highest incidences of crime at 40.38% whereas Franklinville College recorded the least number of crimes of the total crimes recorded in all the colleges at 3.85%.Abalone university recorded the highest number of forcible rape, aggravated assault and arson crimes as compared to other colleges at 50.00% of all crimes committed in these crime categories. Simon State recorded the highest number of property crimes of all other colleges at 48.53%. Abalone University administrators should check forcible rape, aggravated assault and arson because they are more likely to recur. Simon State should focus more on tackling property crime to bring down crime incidences within its precincts.
References
Jelen, B. (2014). Excel 2013 pivot tables offer distinct count. Strategic Finance, 96(4), 52-53 Retrieved from http://search.proquest.com/docview/1614145336?accountid=45049
Jelen, B. (2010). Filtering multiple pivot tables in excel 2010. Strategic Finance, 92(3), 52-53 Retrieved from http://search.proquest.com/docview/751221731?accountid=45049
We can write this or a similar paper for you! Simply fill the order form!
