


DuPont Analysis of companies for the past three years
Order Instructions:
This week the writer will build on what he completed on the first week with order #112856 and will add the respond to the questions hear below as week 2 and will take the completed solutions from #112856 and add as week 1 at the beginning of the paper like that he will be building the paper up as we go forward. Remember this is a continues assignment and it will run for a couple of weeks. As mentioned earlier, week one was order #112856 and the response to the questions below will be week 2 so take note and I have resubmitted a template hear to use to add week one and 2, so let the writer pay attention to those details. Also when the writer adds the references from 112856 to this paper, he must make sure the are in alphabetical order as per APA.
• Investment Analysis and Recommendation Paper – continued from #112856
During this week, you will assess the company you selected for your Investment Analysis and Recommendation Paper relative to its competitors in terms of financial ratios. Financial ratio reports are available on numerous Web sites (examples: Reuters, Google, Finance, Hoovers). Remember, different Web sites may use slightly different definitions.
Using income statements and balance sheets for your company AND at least one of its main competitor’s, respond to the following:
• Calculate the DuPont identity for both companies for the past three years.
• Discuss any differences and/or trends that emerge.
Write up a 2-page summary minimum of your findings, including any calculations you made, and how you gathered your information. Please follow the template and present the information base on the templates headings.
SAMPLE ANSWER
DuPont Analysis of companies for the past three years
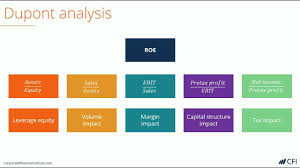
Return on Investment (ROE) is the is one of the most important company analysis tools that is used to measure how well a company manages and creates value to their shareholders. However, the values on the ROE can sometimes be misleading in terms of real value and risks associated with a particular investment. The numbers in the ROE can easily be misleading to financial analysis if the individual components of the ROE have not been broken down to their individual components. In this regard, DuPont can bridge the gap created by the ROE and provide a reliable measure of how the company creates value for its shareholders (Mitchell, Mitchell, & Cai, 2013). DuPont is the financial analysis tool that enables the breakdown of the ROE into its various individual components such as financial leverage, asset turnover, and profit margin (Haskins, 2013). The following is the financial calculation of DuPont of Chesapeake Energy Corporation, together with their competitor, Anadarko Petroleum Corporation (APC) (Cheasapeake Corp, 2015).
DuPont takes utilizes the basis of the individual component of ROE which is given by;
Profit Margin X Asset Turnover X Leverage Factor
Chesapeake Energy Corporation (CEC) Financials for the past three years
| 2014 | 2013 | 2012 | |
| Total Assets | $40,751,000 | 41,782,000 | 41,611,000 |
| Shareholders’ Equity | $16,903,000 | 15,995,000 | 15,569,000 |
| Revenue | $20,951,000 | 17,506,000 | 12,316,000 |
| Net Income | $1,917,000 | 724,000 | 769,000 |
Anadarko Petroleum Corporation (APC) Financials for the past three years
| 2014 | 2013 | 2012 | |
| Total Assets | 61,689,000 | 55,781,000 | 52,589,000 |
| Shareholders’ Equity | 19,725,000 | 21,857,000 | 20,629,000 |
| Revenue | 18,470,000 | 14,581,000 | 13,411,000 |
| Net Income | (1,750,000) | 801,000 | 2,391,000 |
In the year 2012;
The DuPont for Chesapeake Energy Corporation is given by
Net Profit x Asset Turnover x Leverage Factor
(769,000/12,316,000) x (12,316,000/41,611,000) x (41,611,000/12,316,000)
= 0.0624 x 0.256 x 3.379 = 0.054
The DuPont for Anadarko Petroleum Corporation (APC) is given by
(2,391,000/13,411,000) x (13,411,000/52,589,000) x (52,589,000/20,629,000) =
=0.1783 x 0.255 x 2.541 = 0.116
In the year 2013;
The DuPont for Chesapeake Energy Corporation is given by
(724,000/17,506,000) x (17,506,000 / 41,782,000) x (41,782,000/15,995,000) =
0.041 x 0.419 x 2.612 = 0.045
The DuPont for Anadarko Petroleum Corporation (APC) is given by
(801,000/14,581,000) x (14,581,000/55,781,000) x (55,781,000/21,857,000) =
0.055 x 0.21 x 2.55 = 0.029
In the year 2014;
The DuPont for Chesapeake Energy Corporation is given by
(1,917,000/20,951,000) x (20,951,000/40,751,000) x (40,751,000/16,903,000) =
0.091 x 0.514 x 2.411 = 0.113
The DuPont for Anadarko Petroleum Corporation (APC) is given by
(1,750,000/18,470,000) x (18,470,000/61,689,000) x (61,689,000/19,725,000) =
0.095 x 0.299 x 3.127 = 0.089
Differences and trend that emerge
In the year 2012, the operating efficiency of APC (0.18) was higher than that of CEC (0.06) as can be seen in their profit margins. In the same year, it can be deduced that the asset use efficiency of between the two companies are almost the same since they stood at 0.255 for APC and 0.256 for CEC. On the other hand, the financial leverage for CEC was higher (3.4) than the financial leverage for APC (2.5).
In the year 2013, the operating efficiency of APC (0.05) was still higher than that of CEC (0.04). In the same year, the asset use efficiency of CEC was higher than the asset use efficiency of APC. Similarly, CEC had a higher financial leverage in the year 2013 than APC. Overall, it can be deduced that CEC performed better than APC in the year 2013.
In the year 2014, the operating efficiency of APC (0.095) was higher than that of CEC (0.091). However, the asset use efficiency of CEC stood higher (0.5) than that of APC (0.3). On the other hand, APC had a higher financial leverage (3.1) than CEC (2.4) as can be deduced from the financial calculations. The higher the financial leverage, the better a company is placed to provide good value for its shareholders (Brian, Sandra, & Jennifer, 2013)
References
Brian, J. H, Sandra, M. T. & Jennifer, C. H. (2013). Benefit Corporation Concerns for Cheasapeake Corp. (2015). Company Profile: Chesapeake Energy Corporation. MarketLine Financial Service Professionals. Journal of Financial Service Professionals. 74-82.
Haskins, M. E.(2013). A decade of DuPont ratio performance. Management Accounting Quarterly, 14(2), 24-33.
Mitchell, T., Mitchell, S., & Cai, C. (2013). Using the DuPont decomposing process to create A marketing model. Journal of Business & Economics Research (Online), 11(11), 485.
We can write this or a similar paper for you! Simply fill the order form!
