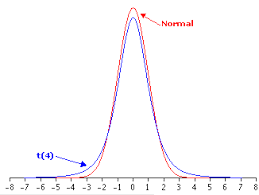
In the following situations, indicate whether you’d use the normal distribution, the t distribution, or neither.
The population is normally distributed, and you know the population standard deviation.
You don’t know the population standard deviation, and the sample size is 35.
The sample size is 22, and the population is normally distributed.
The sample size is 12, and the population is not normally distributed.
The sample size is 45, and you know the population standard deviation.
The prices of used books at a large college bookstore are normally distributed. If a sample of 23 used books from this store has a mean price of $27.50 with a standard deviation of $6.75, use Table 10.1 in your textbook to calculate the following for a 95% confidence level about the population mean. Be sure to show your work.
Degrees of freedom
The critical value of t
The margin of error
The confidence interval for a 95% confidence leve
Statistics students at a state college compiled the following two-way table from a sample of randomly selected students at their college:
Play chess Don’t play chess
Male students 25 162
Female students 19 148
Answer the following questions about the table. Be sure to show any calculations.
How many students in total were surveyed?
How many of the students surveyed play chess?
What question about the population of students at the state college would this table attempt to answer?
State Hº and Hª for the test related to this table.
Answer the following questions about an ANOVA analysis involving three samples.
In this ANOVA analysis, what are we trying to determine about the three populations they’re taken from?
FINAL LAB – LAB 8 – NON-PARAMETRIC STATISTICS USING THE CHI SQUARE
For your Lab 8 you will be analyzing nominal data. Given this you will be using a non-parametric test to analyze the data. Specifically, you will be doing a chi square test. This is done by going into the descriptive statistics and going to the crosstabs.
First, you will need to bring in the data into SPSS. The data is supplied below and you need to simply put the numbers in a new data file. This will not be difficult since there are only 2 columns to enter.
Data for Lab 6
Next, you need to go into the descriptive statistics under the analyze menu. Click on crosstabs and then enter one variable in the row and one variable in the column. Click on options and make sure to then click on the Chi Square statistic. You may also choose to enter the percentages for rows only.
Finally, you will be asked to interpret the output. Given that this is a rape trial, you should be able to add some of your own input on the matter to the discussion.
This is the correct way to write this statistic in your write up:
p = .01
For this final lab you are required to put a poster presentation together that will demonstrate your ability to put an entire study together. I have provided you with an example poster so you can take out the example sections and fill it in with yours. This poster would be something you could submit to a conference if you actually collected the data and analyzed it.
We can write this or a similar paper for you! Simply fill the order form!
The UK has one of the highest cesarean rates in the world
According to the World Health Organisation , The UK has one of the highest cesarean rates in the world. Discuss this statement sociologically, drawing on your knowledge about the medicalisation process (and particularly unnecessary medical intervention) to explain why this might be the case.
A cesarean section (CS) is a surgical process where
birth is through an incision in the wall of the uterus,
rather than through the vagina. In the 1950s, 3% of
births in England were by CS. By the early 1980s this
had risen to 10% and in the 1990s rates started to climb rapidly, from 12% in 1990 to 21% in 2001. These national figures mask local variations
where the CS rate ranges from 10% to 30% between
hospitals. The number of elective CS (where the
decision to carry out CS is taken before labour starts) has risen more slowly than the number of emergency CS.
We can write this or a similar paper for you! Simply fill the order form!
Effects of age differences on Statistics Anxiety and attitude among undergraduate students
Order Instructions:
SPSS
SAMPLE ANSWER
Effects of age differences on Statistics Anxiety and attitude among undergraduate students
Abstract
Statistical anxiety is proving to be a menace in an educational setting especially for students pursuing a statistics-related course. It is exacerbated when students in non-statistical degree programs like sociology and humanities. The age of students has shown disparities in the group of students where older students have been shown to have greater anxiety than the younger students.
Effects of age differences on Statistics Anxiety and attitude among undergraduate
Apprehension to statistical data is by no means a rarity, as it falls under what psychology refers to as “statistics anxiety.” As bizarre as the term may seem, its reference to a person’s discomfort over dealing with anything about statistics attaches with it a cause of concern relating to the ability to present and interpret valuable data. However, according to Onwuegbuzie & Wilson (2003), about 80% of social and behavioural sciences students still experiences statistics anxiety. Thus, this negatively affects the student’s academic performance, including his/her psychological and physiological conditions (Zehra Ali & Iqbal, 2012). In this sense, the focus of this study is the group of students in non-statistical courses like sociology and humanities. The participants will be categorized into traditional and non-traditional students based on their age differences.
The importance of learning more about statistics anxiety relies on the essence of expanding statistics literacy, which is highly important in a democratic setting, where everyone’s input impacts the course of action (Chew & Dillon, 2014), considering the field’s instrumental contribution to the social sciences. Following fkee & Sulaiman (2014), statistical anxiety can be viewed as an obstacle to the student’s learning. Moreover, it is also found out that there is a significant relationship between intolerance of uncertainty and the age of student that highly promotes statistical anxiety (Legum et al., 2013; Williams, 2015). In the light of age demographics, according to Legum et al. (2013), there is a statistical significance between age and the levels of statistics anxiety where older students have shown greater statistical anxiety as opposed to the younger ones.Also student’s attitude towards statistics course may influence his/her performance. According to Sese’ (2015), attitude shows a strong direct analyst of performance and plays a great mediating role within the student’s academic performance. Students who have negative attitudes and unfavourable attitudes may contribute anxiety and low efficiency towards statistics (Dr. Eduljee & LeBourdais, 2015).
However, in a positive view, statistics anxiety is also a necessary provocation to help students to achieve optimal performance ((Dykerman, 2011); (Chei-Chang, Yu-Min, & Li-Tze, 2014); Macher et al., 2012).
The following hypotheses were constructed in the light of the above review:
There is a significant association between age demographics and statistics anxiety
Statistics anxiety heavily influences a student’s attitude towards statistical courses.
Many have come to appreciate the importance of literacy in statistics. This has resulted in an increasing number of statistical courses in various degree programs. According to Amanda (2010), close to 80% of the graduates, exhibit statistics anxiety especially in the fields of social and behavioral sciences. As a result, students usually procrastinate their statistics courses because of such fear (Chew & Dillon, 2015). Chew and Dillon (2014) asserts that empirical data provides evidence that those students who are in non-mathematical degree programs claim that statistics and related courses are the ‘most anxiety-inducing courses’ (Chew & Dillon, 2015). As the literature asserts, students in the non-statistical courses are more or less fearful of statistical courses infused in their degree programs (Chew & Dillon, 2015). This paper seeks to investigate the association between age and statistical anxiety in relation to the consequential development of attitude towards statistical courses.
Anxiety refers to worry and fear that an individual develops in anticipation of a threat even though the outcome is uncertain. In this sense, the individual exhibits fear and worry but is unable to point out the source of the anxiety (Jordan, McGladdery & Dyer, 2014). Regardless, he or she expects something harmful and even painful. The outcome of such behavior results in individuals avoiding likely sources of the anguish (Brown & Tallon, 2015). According to Amanda (2010), anxiety also includes the perception of our inability to control future events and that they might be related to several different events. As a result of the lack of control over the future events, anxiety might occur because people worry that things might happen and cause pain or stress (Bui & Alearo, 2011). Anxiety in the academics has been acknowledged extensively and has been asserted to take several forms including mathematics and statistics anxiety. According to Amanda Williams (2013), statistics anxiety has been considered to be “a multi-dimensional construct.” The six components of statistics anxiety include “worth of statistics, interpretation, test, class anxiety, computation self-concept, and the fear of asking help” (Williams, 2013). The aspect of interpretation anxiety refers to the fear and worry developed when students are faced with the task of interpreting the statistical results. Those with high scores on this aspect find statistics to be very provoking (Dykerman, 2011).
Several researchers have correlated it with age differences where they assert that older students exhibit more fear and worry when it comes to mathematical and statistical courses (Morsanyi et al., 2016). A study by Ngoc and (2011) involving 104 participants discovered that older students depicted the highest levels of anxiety as opposed to the younger ones. However, what stands out clear is that statistics anxiety depicted a direct correlation with age (Devaney, 2010). In other words, the traditional students are more anxious when compared to the non-traditional ones.
Methodology
The literature review pointed out that the two groups of students who are to be studied were the traditional and non-traditional students. Following their definition, the traditional students are those who studied mathematics or statistically related courses at the 11th year or below. The non-traditional students, on the other hand, are those who studied after the 11th year which includes the 12th year and university level. The desired sample size was 100 students but downsizing was solely for convenience purposes. A total of 50 students, 26 males and 24 females were involved in the data collection process of this study. Their ages varied from 18 years to 30 years. This is because students older than 30 were present in the university environs but most of them are not undergraduates.
This study involves assessing students to measure their levels of anxiety concerning taking statistical courses. During the data collection process, students were approached randomly regardless of their degree program.
The data was collected via a questionnaire which contains only one open-ended questions. Firstly, the student is to provide a general comment about the course expectations followed by an anxiety scale trying to score their level of anxiety when it comes to the course (Welch et al., 2015). The Likert scale is next component used to measure the attitudes of students followed by the demographic information.
Results
Frequency
Percent
Valid Percent
Cumulative Percent
Valid
26 and below
30
60.0
61.2
61.2
Above 26
19
38.0
38.8
100.0
Total
49
98.0
100.0
Missing
Missing Values
1
2.0
Total
50
100.0
Table 1: Descriptive statistics for the age variable
Frequency
Percent
Valid Percent
Cumulative Percent
Valid
Year 11 and Below
14
28.0
28.0
28.0
Year 12 and Above
36
72.0
72.0
100.0
Total
50
100.0
100.0
Table 2: The level of mathematics education
CommentAttitude
N
Mean
Std. Deviation
Std. Error Mean
The Approximate attitude of each student towards statistics.
Positive
34
31.0588
3.77344
.64714
Negative
16
22.1875
.83417
.20854
Table 3: Group statistics for the independent t test for the student attitude variable.
Levene’s Test for Equality of Variances
F
Sig.
The Approximate attitude of each student towards statistics.
Equal variances assumed
66.509
.000
Equal variances not assumed
Table 5: The independent t test values for the attitude variable
CommentAnxiety
N
Mean
Std. Deviation
Std. Error Mean
The Approximate levels of anxiety for each student.
High Anx
11
36.64
1.567
.472
Low Anxi
37
28.70
3.527
.580
Table 6: Group statistics for the independent t test for the level of anxiety
Levene’s Test for Equality of Variances
F
Sig.
The Approximate levels of anxiety for each student.
Equal variances assumed
4.692
.036
Equal variances not assumed
Table 7: The independent t test for the anxiety variable
CommentAnxiety
Total
High Anx
Low Anxi
The Students’ age.
26 and below
7
23
30
Above 26
5
14
19
Total
12
37
49
Table 8: A crosstab showing the comparison of the students’ age and levels of anxiety
CommentAttitude
Total
Negative
Positive
The Students’ age.
26 and below
7
23
30
Above 26
9
10
19
Total
16
33
49
Table 9: A crosstab showing the comparison of the students’ age and attitude
CommentAttitude
Total
Negative
Positive
The Students’ age.
26 and below
7
23
30
Above 26
9
10
19
Total
16
33
49
Table 10: A crosstab showing the students’ level of math education and their attitudes
CommentAnxiety
Total
High Anx
Low Anxi
The highest level of Math studied.
Year 11 and Below
3
11
14
Year 12
4
11
15
University
6
15
21
Total
13
37
50
Table 11: A crosstab showing the students’ level of math education and their level of anxiety
Discussion
Following the study, the age variable was categorized into two groups, those aged 26 years and below, and those above 26 years. The former group refers to the non-traditional students whereas the latter comprised of the traditional ones. 60% of the sample was above 26 years whereas the remaining 40% were above 26 years. Also, 7 out of 30 students aged below 26 years depicted high levels of anxiety while 5 out 19 students aged above 26 years exhibited anxiety. 23 of 30 students remaining aged below 26 years showed low stress levels and 14 of 19 students above 26 years were also not anxious. 7 out 30 students aged below 26 years portrayed a negative attitude while the remaining 23 had a positive attitude. The non-traditional students were more fearful of statistics than the traditional ones. This could be attributed to the fact that the older students had learned about statistics in their recent past coupled with the fact that they also have higher levels of mathematical education (González et al., 2016). For those over 26 years, 9 out of 19 students had a negative attitude while the remaining 10 had a positive attitude. As such, more students with a positive attitude exhibited low levels of anxiety while the few who had a negative attitude had high levels of anxiety and stress.
Following the independent t-test, there were significant differences between the sample group means considering that a significant value of 0.036 was achieved which is less than 0.05. There were several groups obtained from the data extrapolated from the variables and they include high levels of anxiety, low anxiety levels, positive and negative attitude. This statistical finding could be explained by the fact that students with higher levels of anxiety developed a negative attitude towards statistics and vice versa. This study is significant and can prove to be helpful in the development and implementation of interventions for students with statistics anxiety in a bid to reduce the dislike for the non-mathematical courses taking statistics (Morsanyi et al., 2016).
Reference
Bui, N. H., & Alearo, M. A. (2011). Statistics Anxiety And Science Attitudes: Age, Gender, And Ethnicity Factors. College Student Journal, 45(3), 573-585.
Brown, M. J., & Tallon, J. (2015). The Effects Of pre-Lecture Quizzes On Test Anxiety And Performance In A Statistics Course. Education, 135(3), 346-350.
Chei-Chang, C., Yu-Min, W., & Li-Tze, L. (2014). Reducing Statistics Anxiety And Enhancing Statistics Learning Achievement: Effectiveness Of A One-Minute Strategy. Psychological Reports, 115(1), 297-310.
Chew, P. H., & Dillon, D. B. (2015). Statistics Anxiety and Attitudes Toward Statistics. Annual International Conference On Cognitive & Behavioral Psychology, 148-151.
Devaney, T. A. (2010). Anxiety and attitudes of graduate students in on-campus vs. online statistics courses. Journal of Statistics Education, 18(1), 1-15.
Dykeman, B. F. (2011). Statistics Anxiety: Antecedents And Instructional Interventions. Education, 132(2), 441-446.
Eduljee, N. B., & LeBourdais, P. (2015). Gender differences in statistics anxiety with undergraduate college students. The International Journal of Indian Psychology, 2(3), 69-82.
Erfanmanesh, M. (2016). Information seeking anxiety: Effects of gender, level of study and age. Library Philosoph and Practice (e-journal), 1-20.
González, A., Rodríguez, Y., Faílde, J. M., & Carrera, M. V. (2016). Anxiety in the statistics class: Structural relations with self-concept, intrinsic value, and engagement in two samples of undergraduates. Learning & Individual Differences, 45214-221.
Jordan, J., McGladdery, G., & Dyer, K. (2014). Dyslexia in Higher Education: Implications for Maths Anxiety, Statistics Anxiety and Psychological Well-being. Dyslexia (10769242), 20(3), 225-240.
Legum, H., Schmitt, B., Pointer, M., Murray, R., O’Bryant, B., Owens-Southall, M., & Jeter-Twilley, R. (2013).The relationship between undergraduate and graduate students’ statistical anxiety, worry levels, and their coping skills based on age and gender,The AABSS Journal 17, 305-314.
Macher, D., Papousek, I., Ruggeri, K., and Paechter, M. (2015). Statistics anxiety and performance: Blessings in disguise.Frontiers in Psychology, 6, doi: 10.3389/fpsyg.2015.01116.
Ngoc, B. H., & Alearo, M. A. (2011). Statistics anxiety and science attitudes: age, gender and ethnicity factors. College Student Journal, 55(3), p573.
Sesé, A., Jiménez, R., Montaño, J., & Palmer, A. (2015). Can Attitudes toward Statistics and Statistics Anxiety Explain Students’ Performance? // ¿Pueden las actitudes hacia la estadística y la ansiedad estadística explicar el rendimiento de losestudiantes?.REV PSICODIDACT, 20(2), 285-304. http://dx.doi.org/10.1387/revpsicodidact.13080.
Welch, P. S., Jacks, M. E., Smiley, L. A., Walden, C. E., Clark, W. D., & Nguyen, C. A. (2015). A Study of Statistics Anxiety Levels of Graduate Dental Hygiene Students. Journal Of Dental Hygiene, 89(1), 46-54.
Williams, A. S. (2013). Worry, Intolerance of Uncertainty, and Statistics Anxiety. Statistics Education Research Journal, 12(1), 48-59.
Williams, A. (2015). Statistics anxiety and worry: the roles of worry beliefs, negative problem orientation, and cognitive avoidance, Statistics Education Research Journal, 14(2), 53-75.
Zehra Ali, A. & Iqbal, F. (2012). Statistics Anxiety among Psychology Graduates: An Analysis, 53, 113. http://dx.doi.org/10.7763/IPEDR. 2012.
We can write this or a similar paper for you! Simply fill the order form!
This signature assignment is designed to align with specific program student learning outcome(s) in your program. Program Student Learning Outcomes are broad statements that describe what students should know and be able to do upon completion of their degree. The signature assignments might be graded with an automated rubric that allows the University to collect data that can be aggregated across a location or college/school and used for program improvements.
Purpose of Assignment
The purpose of this assignment is for students to synthesize the concepts learned throughout the course. This assignment will provide students an opportunity to build critical thinking skills, develop businesses and organizations, and solve problems requiring data by compiling all pertinent information into one report.
Assignment Steps
Resources: Microsoft Excel®, Signature Assignment Databases, Signature Assignment Options, Part 3: Inferential Statistics
Scenario: Upon successful completion of the MBA program, say you work in the analytics department for a consulting company. Your assignment is to analyze one of the following databases:
Manufacturing
Hospital
Consumer Food
Financial
Select one of the databases based on the information in the Signature Assignment Options.
Provide a 1,600-word detailed, statistical report including the following:
Explain the context of the case
Provide a research foundation for the topic
Present graphs
Explain outliers
Prepare calculations
Conduct hypotheses tests
Discuss inferences you have made from the results
This assignment is broken down into four parts:
Part 1 – Preliminary Analysis
Part 2 – Examination of Descriptive Statistics
Part 3 – Examination of Inferential Statistics
Part 4 – Conclusion/Recommendations
Part 1 – Preliminary Analysis (3-4 paragraphs)
Generally, as a statistics consultant, you will be given a problem and data. At times, you may have to gather additional data. For this assignment, assume all the data is already gathered for you.
State the objective:
What are the questions you are trying to address?
Describe the population in the study clearly and in sufficient detail:
What is the sample?
Discuss the types of data and variables:
Are the data quantitative or qualitative?
What are levels of measurement for the data?
Part 2 – Descriptive Statistics (3-4 paragraphs)
Examine the given data.
Present the descriptive statistics (mean, median, mode, range, standard deviation, variance, CV, and five-number summary).
Present any graphs or charts you think are appropriate for the data.
Note: Ideally, we want to assess the conditions of normality too. However, for the purpose of this exercise, assume data is drawn from normal populations.
Part 3 – Inferential Statistics (2-3 paragraphs)
Use the Part 3: Inferential Statistics document.
Create (formulate) hypotheses
Run formal hypothesis tests
Make decisions. Your decisions should be stated in non-technical terms.
Hint: A final conclusion saying “reject the null hypothesis” by itself without explanation is basically worthless to those who hired you. Similarly, stating the conclusion is false or rejected is not sufficient.
Part 4 – Conclusion and Recommendations (1-2 paragraphs)
Include the following:
What are your conclusions?
What do you infer from the statistical analysis?
State the interpretations in non-technical terms.
What information might lead to a different conclusion?
Are there any variables missing?
What additional information would be valuable to help draw a more certain conclusion?
My Essay Choice:
Option 3: Consumer Food
1. Suppose you want to test to determine if the average annual food spending for a household in the Midwest region of the U.S. is more than $8,000. Use the Midwest region data and a 1% level of significance to test this hypothesis. Assume that annual food spending is normally distributed in the population.
2. Test to determine if there is a significant difference between households in a metro area and households outside metro areas in annual food spending. Let α = 0.01.
3. The Consumer Food database contains data on Annual Food Spending, Annual Household Income, and Non-Mortgage Household Debt broken down by Region and Location. Using Region as an independent variable with four classification levels (four regions of the U.S.), perform three different one-way ANOVA’s—one for each of the three dependent variables (Annual Food Spending, Annual Household Income, Non-Mortgage Household Debt). Did you find any significant differences by region?
We can write this or a similar paper for you! Simply fill the order form!
Limitations and Dangers of Statistical Methods Your report needs to have three distinct and clearly marked sections:
a) The first part directly and succinctly lists five (5) of the most important insights about the limitations and dangers of statistical methods presented in the article.
Limitations and Dangers of Statistical Methods
Please number these, and express each of them as clearly as you can in your own words, using a single sentence of 25 words or less (for each insight).
b) The second part comprising several paragraphs (about 300-350 words total) will discuss the following question: What consequences—both positive and negative—do you think would follow if we could place a moratorium on the use of statistical analysis in our research work? This is a more creative task, one that goes beyond the actual arguments presented in the article itself to consider larger implications.
c) Finally, in a single brief paragraph (about 40-50 words), the third part will summarize how your thinking has been affected by the article, regardless of whether you have mostly agree or generally disagree with Grumet’s ideas.
Basic Business Statistic Project Paper Use only clean sheets of good quality 8 1/2″ x 11″ white paper. Text should be typed on one side only.
Basic Business Statistic Project Paper
Do not put any perfume or cologne on the sheets, neither try to decorate the sheets of paper; remember, it’s an academic piece of writing. A title page is essential. Pages should be consecutively numbered, with numbers put in the upper right hand corner, flush with the right margin and 1/2″ from the top with 12 font size and 1.5 spacing. The science of statistics makes a fundamental distinction between two types of data sets, population data and sample data.
A detailed report on leading organizational development (OD). Intervention.
The length of the report is minimum 3000 words; maximum 4000 words.
This in-depth analytical work will assess your skill to adopt appropriate OD principles in application to policy making and change regarding your place of employment (work)
Descriptive Statistics Analysis and Write up Description
Assignment #2: Descriptive Statistics Analysis and Write up
In the first assignment (Assignment #1: Descriptive Statistics Analysis Data Plan), you developed a scenario about annual household expenditures and a plan for analyzing the data using descriptive statistic methods.
Descriptive Statistics Analysis and Write up
The purpose of this assignment is to carry out the descriptive statistics analysis plan and write up the results. The expected outcome of this assignment is a two to three page write-up of the findings from your analysis as well as a recommendation.
Descriptive Statistics Analysis and Write up Assignment Steps
Step #1: Review Feedback from Your Instructor
Before performing any analysis, please make sure to review your instructor’s feedback on Assignment #1: Descriptive Statistics Data Analysis Plan. Based on the feedback, modify variables, tables, and selected statistics, graphs, and tables, if needed.
Step #2: Perform Descriptive Statistic Analysis
Task 1: Look at the dataset.
(Re)Familiarize yourself with the variables. Review Table 1: Variables Selected for the Analysis you generated for the first assignment as well as your instructor’s feedback. In addition, look at the data dictionary contained in the data set for information about the variables.
Select the variables you need for the analysis.
Task 2: Complete your data analysis, as outlined in your first assignment, with any needed modifications, based on your instructor’s feedback.
Calculate Measures of Central Tendency and Variability. Use the information from Assignment #1 – Table 2. Numerical Summaries of the Selected Variables. Here again, be sure to see your instructor’s feedback and incorporate into the analysis.
Prepare Graphs and/or Tables. Use the information from Assignment #1 – Table 3. Type of Graphs and/or Tables for Selected Variables. Here again, be sure to see your instructor’s feedback and incorporate into the analysis
Step #3: Write-up findings using the Provided
Descriptive Statistics Analysis and Write up Template
For this part of the assignment, write a short 2-3 page write-up of the process you followed and the findings from your analysis. You will describe, in words, the statistical analysis used and present the results in both statistical/text and graphic formats.
Here are the main sections for this assignment:
Identifying Information. Fill in information on name, class, instructor, and date.
Introduction. For this section, use the same scenario you submitted for the first assignment and modified using your instructor’s feedback, if needed. Include Table 1 (Table 1: Variables
Selected for the Analysis) you used in Assignment #1 to show the variables you selected for the analysis.
Data Set Description and Method Used for Analysis. Briefly describe the data set, using information provided in the data set file. Also describe what method(s) (i.e., TI Calculator, free web applets, Excel) you used to analyze the data.
Results. In this section, you will report the results of your descriptive statistics data analysis. For each variable, fill in the following sections:
Variable (#): (Name). Fill in the name of the variable. Note: Income was included for variable 1.
Numerical Summary. Fill in Table . Descriptive Analysis for Variable with your
computation. Below is the template table; be sure to include the name(s) of the
measures used as well as their values. Since there will be no measure of dispersion for the qualitative variable, just enter N/A for not applicable. Note: The information for the required variable, “Income,” has already been partially completed and can be used as a guide for completing information on the remaining variables.
Graph and/or Table. Put the graph or table for the variable in this section.
Description of Findings.
Briefly describe the descriptive statistics measure(s) that was/were calculated
and explain why was it/they the appropriate one(s) to use.
Describe the results of the analysis in everyday language. Please consult your
textbook and information contained in our LEO classroom for examples.
Discussion and Conclusion. Organize the discussion to address findings for which you presented results. Briefly discuss each variable in the same sequence as presented in the results. What has the highest expenditure? What variable has the lowest expenditure? If you were to recommend a place to save money, which expenditure would it be and why? Note: The section should be no more than 2 paragraphs.
The Effect of Stress Level and Age on Life Satisfaction
The effect of stress level and age on life satisfaction independent variables (IVS) are stress level and age (YOUNG, OLD) and Dependent variable (DV) is life satisfaction.
Perceived stress level scale (pss) and Satisfaction with life scale (swls)—2 questionnaires used for measurement. Use an appropriate scale construction by analyzing for the reverse the scale
Perform median split
Look for Outliers and Normality Homogeneity tests
Outliers and Normality Homogeneity tests
Analyze a 2 way Anova SPSS output for the following data.
Look at the output for Levene’s test. Is the assumption of homogeneity met?