Please follow the below guidelines to write this paper. I will email the white paper at support@australiaessays.com
Please Read and Summarize above White Paper “Gartner Handout – Infrastructure as a Service” in APA style format (3-4 pages). Students should also integrate answers to the following three questions in their papers:
§ What is the white paper trying to say?
§ What is the significance of what you read?
§ How does the material influence you?
Papers will be graded for accuracy of interpretation, rigor of argument, and clarity of expression.
Thanks,
Customer
SAMPLE ANSWER
With the market evolution and growing demand for service-based cloud computing infrastructure, there exists a need for reputable cloud infrastructure service providers to improvise the traditional platforms. Though there are other services provided by the magic quadrant, the paper only evaluates cloud compute infrastructure as a service provider. Cloud computing is a service that offers flexible information technology components through the use of the internet.
Cloud computing infrastructure has evolved from being offered as a physical component to a service and still ably competes with data centers and infrastructure based IT initiatives. Other elements of the service-based infrastructural market are cloud printing and cloud storage. However, cloud computing consists the largest market of the cloud Compute Infrastructure as a service (IaaS). The paper provides an evaluation of cloud computing IaaS with the vendors that are known to offer the service.
As a major component of the magic quadrant, cloud computing infrastructure as a service is an automatic and standardized component that allows computer resources to be transferred to customers by service providers on demand. The computer resources can be shared by different tenants or by a single tenant and hosted by the service provider or on customer’s premises. The service infrastructure offers user-interfaces directly to the client.
Cloud infrastructure can be in the form of a service or a technology platform. Cloud infrastructure as a service is advantageous to the technology platform in that it offers direct services to the customer through self-service. However, there are capabilities that the technology platform offers that the service infrastructure is unable to perform on its own. Cloud computing IaaS has to use cloud-enabled system infrastructure to offer activities such as outsourcing and data-enabled hosting. Still, on its own, cloud computing IaaS is capable of providing a variety of offerings to the customer.
Gartner clients have a dire need to control IT operations. The evaluation covers the needs of the clients ranging from enterprises, retail and technology firms. The quadrant talks about the development, analysis, and production of the cloud computing IaaS internally and externally. The service hosts diverse workloads for a range of design application. Through the magic quadrant, an emphasis is given to standardized self-service and automation.
Magic Quadrants serve the different needs of customers. Customers are more interested in self-service cloud computing infrastructure. To make the service more reliable, it can still be complemented by negligible amounts of dedicated servers. The magic quadrants offer customized services to organizations that need the service or that want to supplement their traditional hosting platform. Magic Quadrants for Managed Hosting are cloud computing service providers based in North America, Asia, and Europe. The quadrants also provide custom-made cloud computing services for outsourcing of data and utility offerings.
The providers of IaaS are known for offering exceptionally high-quality services that have a high-performance rate. Also, the providers are always available for customer’s inquiries and support. The magic quadrant specifies unique providers that were evaluated. The providers are profiled about their strengths and weaknesses.
Characteristics of Magic Quadrant vendors include:
Ownership of private and public cloud services. The customers are placed on standard infrastructure and cloud-enabled tools.
The providers lay emphasis on hybrid IT elements but with a view on security and self-service control. Though some of the providers target start-ups, they normally lack the capabilities needed by big organizations. It, therefore, becomes important for the selected providers to provide unique offerings that allow easy access to cloud computing infrastructure.
Most of the vendors combine resilient support with maintenance windows for efficient service provision.
Providers mostly do not oversubscribe Random Access Memory resources, but those that do not assure of allocations of resources are identified and noted. However, not all providers have the same storage capability, and it is only those in the quadrant that offer alternatives for storage purposes.
Most of the vendors possess extra SLAs to provide extensive network services, customer services and all of the customer’s inquiries.
Customers define the scope of the services offered hence the infrastructural service is not automatic. For that reason, some providers specialize in offering disaster recovery in case customers want to re-instate the services. Vendors support virtual networking that is secure with the inclusion of firewall. The providers have extra security services that they offer to their customers at varying amounts depending on the customer. Self-service allows customers to bring their portals and VM image.
Finally, after evaluation, the vendors were found to be financially stable, offer contracts in English, sign contracts with clients and provide managed services on Iaas cloud computing.
As a student, the analysis has given an insight on evolution of technology and how traditional computing methods are being replaced with modern technology. Globalization of services and customer’s demand for technology that they can have control over has driven the invention of the Magic Quadrant. The paper provides an overview of the gap that technology is creating in the evolving world and the need for virtual technology. Before one goes for cloud computing services, it is important to analyze the providers since some vendors do not have the required tools for provision of the service.
The paper influences the aspiration for invention in virtual technology to meet the modern market demands. The high number of vendors is attributable to the market demand and therefore means that technology innovation is the new market driving force. Career in software development is not to be underrated in the new digital era.
References
Gartner (2014). Magic Quadrant for Cloud Infrastructure as a Service: Case Study.
We can write this or a similar paper for you! Simply fill the order form!
Evaluation of Business Performance Financial Measures Order Instructions:
Evaluation of Business Performance Financial Measures
SEE ATTACHED
Evaluation of Business Performance Financial Measures Sample Answer
Executive Summary
Before investing in any organization, it is imperative to look at the company’s finances as well as its overall performance (Brigham & Ehrhardt, 2013). This paper looks at the different financial metric for two companies in the aerospace and defense industry; BAE Systems and Rolls-Royce. Some of the key financial ratios addressed include profitability ratios, efficiency ratios, liquidity ratios, and capital gearing ratio. On the same note, the paper performs horizontal and vertical analysis of the two companies. The paper uses secondary analysis of the firm’s annual reports and other financial sources to collect and analyze data. The paper found out that the profitability of BAE System has significantly increased because of decreased demand for its products. On the other hand, Rolls-Royce has been enjoying tremendous growth over the years and this is evident from the increasing price of its Rolls-Royce Shares.
Table of Contents
Executive Summary. 2
Introduction. 5
BAE Systems. 5
Rolls-Royce Holdings PLC.. 6
Financial Ratio Analysis of BAE Systems and Rolls-Royce. 7
Evaluation of Business Performance Financial Measures Introduction
The Aerospace and defense industry is divided into aerospace and defense segment. The aerospace segment primary activities are the designing, producing and selling of commercial aircraft (Müller, 2014). On the other hand, the defense industry produces military weapons and systems for states. These systems are designed to function in the air, on land, or in the sea. This industry is also responsible for the manufacturing of space vehicles such as satellites used for both military and commercial use. BAE Systems and Rolls-Royce Holdings plc are the main players in the United Kingdom market. The two companies have also been selected to explore the future benefits and opportunities of drone technology.
The purpose of this paper is to do a comparative analysis of the two main companies in the Aerospace and Defense in the United Kingdom BAE Systems and Rolls-Royce Holdings. To achieve this, the paper looks at the different financial ratios compare for the two British corporations.
BAE Systems
BAE Systems is a British multinational public limited company in the defense security and aerospace industry. The Corporation headquarters is located in London, United Kingdom. The corporation traces his roots to the year 1999 where it was formed through a merger of General Electric Company (GEC) and Marconi Electronic Systems. BAE Systems is among the best defense contractors in the world. The company’s main operations are done in the United Kingdom and the United States of America (Baesystems.com, 2016). Other main markets for BAE System products are India, Australia, and Saudi Arabia.
The company employs more than 88,200 employees across the world. The key businesses of BAE Systems include Military and technical services, defense, security, cyber and intelligence, IT and information systems, electronics and systems integration as well as consultancy services (Gopalakrishnan et al., 2012). BAE system finances its business operations using equity funding and debt financing. The organization raises its finance through the capital market and bank borrowing. As at the end of the year 2012, the company had a capital of 13,312 million pounds (total equity of 3,774 million pounds, and a debt of 9,538 million pounds) (BAE Systems: Annual Report, 2014).
Rolls-Royce Holdings PLC
Rolls-Royce Holdings is a British multinational public limited holding corporation. The firm’s headquarters is located in Westminster, London. The company was created through a partnership between by Henry Royce and Charles Rolls in the year 1906. Rolls-Royce designs, assembles and sales power systems used in aviation and automobile industries, marine propulsion and energy sectors (Rolls-royce.com, 2016). Rolls Royce is the second largest corporation producing aircraft engines.
The company employs about 40,000 workers in the whole world (Rolls-Royce Holdings plc Annual Report, 2014). Some of the key products and services offered by Rolls-Royce Holdings include Defense Aerospace, Civil Aerospace, Marine, and Energy. Rolls-Royce also finances its business activities through equity funding and debt financing (Bank and Capital Market borrowing). By the end of the year 2012, the organization had a total capital of £10,921 million (equity of £6,105 million and debt of £4,816) (Müller, 2014).
Financial Ratio Analysis of BAE Systems and Rolls-Royce
Profitability Ratios
Profitability ratios are financial metrics used to evaluate the performance of a company. A company that has a higher value compared to that of its competitor or the ratio calculated in the previous financial period indicates that the organization is performing well.
Gross Profit
Gross profit margin is one of the profitability analyzes metric that shows a company’s financial health by calculating the proportion of money that remains after considering the cost of goods sold. In our case, the BAE Systems Gross profit margin is as at 31st Dec 2014, is 60.4% while the Gross profit margin for Rolls-Royce is 23.3% (Financials.morningstar.com, 2016). This indicates that BAE Systems earns more revenue as compared to Rolls-Royce thus, more profitable.
Return on Shareholders’ Investment Ratio
This metric is used to compute the overall profitability of a firm. Return on Shareholder’s Equity can also be termed as Return on Equity. To compute Return on Equity (ROE), we divide net revenue after interest and tax by average stockholders’ equity.
As at 31st Dec 2014, the Return on equity for BAE Systems is 28.34%. On the other hand, the Return on Equity for Rolls-Royce is 1.15%. The two values indicate that BAE Systems is also performing better as compared to Rolls-Royce because the ability to generate profit is higher for BAE Systems as compared to Rolls-Royce (Financials.morningstar.com, 2016).
Return on Capital Employed
Return on Capital Employed (ROCE) is also a financial metric used to compute the efficiency of a company in generating profits for its capital employed (Brigham, E., & Ehrhardt, 2013). To arrive at ROCE, we compare net operating profit with capital employed.
Return on Capital Employed = (Net operating profit)/(Capital Employed)
For BAE Systems; Net operating profits is 740, total assets 19,788, and current liabilities 8,045. Therefore, ROCE will be [740/ (19,788-8,045)] which equal to 0.0630. On the other hand, for Rolls-Royce; Net operating profits is 69, Total Assets 22,224, and current liabilities 7,685. Therefore, the ROCE will be [69/(22,224-7,685)] which equal to 0.00475. Therefore, BAE Systems is more profitable as compared to Rolls-Royce. This is because every dollar invested by BAE Systems earns $0.0630 while every dollar invested on Rolls-Royce earns $0.00475.
Return on assets
Return on asset is also a profitability measure that computes the net income produced by total assets during a specific period (Schmeisser et al., 2014). To get ROA, we divide net income by average total assets. For BAE Systems, the Return on assets is 3.75%. On the other hand, the return on assets for Rolls-Royce is 0.30%. This indicates that BAE is more efficient in managing assets to generate profit during an accounting year.
Efficiency Ratio
Efficiency ratios are financial metrics used to evaluate how efficient a firm utilizes its assets to generate revenues. Efficiency ratios also evaluate how companies effectively manage their resources (Collier, 2015).
Account Receivable turnover ratio
This ratio among the efficiency ratios that compute the number of times a firm can convert its account receivables into cash in a given period (Fernández, 2013). The ratio is arrived at by dividing Net Credit Sales by Average Account Receivable. In our case, the account receivable ratio for BAE Systems is 14.89 while the account receivable for Rolls-Royce is 8.77. This indicates that BAE Systems is more efficient in collecting credit sales from customers compared to Rolls-Royce.
Inventory Holding Period
It is also referred to as Days Sales of Inventory (DSI) which is a financial metric used to determine the time taken for a firm to turn its inventory into sales. The Days Inventory for BAE Systems is 40.89 while the Days inventory for Rolls-Royce is 105.7 (Financials.morningstar.com, 2016). This indicates that BAE Systems turns its inventory into sales faster as compared to Rolls-Royce.
Accounts Payables Periods
This metric evaluates a firm’s obligation to settle short-term debts to its creditors. The account payable for BAE Systems in the year 2014 was valued at 21.79 while the Accounts Payables for Rolls-Royce is 6.07. BAE Systems has a higher Accounts payable period indicating that BAE Systems gets a maximum advantage of using credit purchase.
Fixed Asset Turnover Ratio
This ratio is an efficiency metric that compares net sales to net fixed asset. The fixed asset turnover for BAE Systems is 8.75 while the fixed asset turnover for Rolls-Royce is 4.02. This implies that BAE Systems is doing an effective job of generating sales with few fixed assets as compared to Rolls-Royce.
Inventory Turnover
This financial metric measures the efficiency of a company by looking at how effectively inventory is managed (Chen & Wang, 2012). The inventory turnover ratio for BAE Systems is 8.93 while the inventory turnover ratio for Rolls-Royce is 3.46. This shows that BAE Systems is more efficient for controlling the firm’s merchandise.
Liquidity Ratios
Liquidity ratios are financial ratios that are utilized by investors, management, and other investors to determine a firm’s ability to settle its short-term debts. Examples of liquidity ratios include current ratio, operating cash flow statement, and the Acid-test Ratio.
Current Ratio
The current ratio is utilized by financial users such as investors to find out if a company can be able to settle its liabilities such as debts using its current assets (Brealey et al., 2012). In our case, BAE Systems current ratio for the year 2014 is 0.74. On the other hand, the current ratio for Rolls-Royce Holdings is 1.46. Therefore, Rolls-Royce is more liquid as compared to BAE Systems and thus, the ability of Rolls-Roy’s to meet its short-term debts is higher as compared to BAE Systems.
Acid Test Ratio
Acid test ratio is a liquidity metric that evaluates a firm’s ability to settle current liabilities by means of assets that can be converted into cash within a period of 90 days. As at 31st, Dec 2014, BAE systems had a quick ratio of 0.62. On the other hand, the quick ratio for Rolls-Royce is 1.07. Therefore, Rolls-Royce has a higher acid test ratio indicating that the company is in a position to settle off any reduction in its business as compared to BAE Systems.
Cash Statements
Cash flow analysis is also important when determining the financial strength of business. Cash flow budget is important when it comes to projecting sources and application of funds in upcoming projects. It is important to identify cash deficit earlier and take corrective actions. The free cash flow for BAE Systems is $347 while the free cash flow for rolls-Royce is 176. This indicates that BAE Systems have a higher amount of free cash flow available for use in business operations.
Gearing Ratios
Gearing ratio is an important financial metric used to evaluate the proportion of a firm’s borrowed funds to equity. The main gearing ratio is the debt to equity ratio which is used to calculate the relative proportion of shareholders equity and debts used to finance a firm’s business operations. In our case, the debt to equity ratio for BAE Systems is 1.56 while that for Rolls-Royce is 0.34 (Financials.morningstar.com, 2016). Therefore, BAE Systems has a higher gearing ratio and thus vulnerable to ups and downs in the business cycles as compared to Roll-Royce.
Financial Leverage
This financial ratio is used calculate the value of equity in a firm by examining the overall debt picture. In our case, the financial leverage ratio for BAE Systems is 10.74 while that for Rolls-Royce is 3.48. Therefore, BAE Systems have higher debts as compared to Rolls-Royce.
Horizontal analysis
The horizontal financial analysis addresses the financial changes that have occurred in an organization over the years. For BAE Systems, most notable changes are seen in the revenues. The firm’s revenue has been decreasing over the years from a value of 17,770 million in the year 2011 to a value of 15,430 million in the year 2014. Rolls-Royce Revenue has also been increasing over the years from sales of 11,124 million in the year 2011 to sales of 13, 736 million in the year 2014. This indicates that the industry has been growing over the years, and business activities are booming.
Operating profits have been decreasing in the industry also over the years. BAE Systems recorded a decreasing operating profit from 1,377 million in the year 2011 up to 1,223 million in the year 2014 (Financials.morningstar.com, 2016). On the other hand, Rolls-Royce operating profits have also been increasing from a value of 1,091 million in the year 2011 to a value of 1,470 million in the year 2013. However, the firm recorded a drop in sales in the year 2014. The sales dropped to a value of 1,286 million dollars.
Similarly, the net profits have been decreasing in the industry over the years. BAE Systems recorded decreasing net profits from a value of 1,240 million in the year 2011 to a value of 752 million in the year 2014. On the other hand, Rolls-Royce operating income increased from a value of 850 million in 2011 to 2,281 million in 2012. However, the value decreased in 2014 to 1,379 million.
Vertical Analysis
BAE Systems Vertical Analysis for the last three years
2012
2013
2014
Total Assets
22,274
100%
19,681
100%
19,788
100%
Total Non-current assets
15, 296
68.67%
13,512
68.66%
13,811
69.79%
Total current Assets
6,978
31.33%
6,169
31.34%
5,977
30.21%
Total Current Liabilities
8,917
40%
8,445
42.91%
8,045
40.66%
Total long term liabilities
18,554
83.3%
16,300
82.82%
17,946
90.69%
Total shareholders’ equity
3,720
16.7%
3,381
17.18%
1,842
9.31%
From the vertical analysis of BAE Systems, it is evident that there is a significant increase in the proportion of non-current assets to the total assets over the three years. There is also a significant decrease in the proportion of total shareholders’ equity to the total assets.
Rolls-Royce Vertical Analysis
2012
2013
2014
Total Assets
18,115
100%
23,063
100%
22,224
100%
Total Non-current assets
8,522
47.04%
10,245
44.44%
11,036
49.66%
Total current Assets
9,593
52.95%
12,818
55.57%
11,188
50.34%
Total Current Liabilities
7,194
39.71%
9,780
37.52%
7,685
34.58%
Total long term liabilities
4,833
26.68%
7,678
33.29%
8,157
36.7%
Total shareholders’ equity
6,088
33.60%
5,605
24.30%
6,382
28.72%
From Rolls-Royce analysis, there is a significant decrease in the proportion of total current liabilities to the total assets. However, the rest of the attributes are generally balanced.
Comparative Analysis
It is evident from profitability ratios that BAE systems are earning more revenue as compared to Rolls-Royce. BAE Systems is more efficient also in managing assets as compared to Rolls-Royce. However, BAE Systems profits have been decreasing over the years. On the other hand, Rolls-Royce profits have been increasing over the years. Rolls-Royce is also more lucrative for investors as compared to BAE systems because the company has higher Earnings per Share. Despite the fact that Rolls-Royce has higher Earnings per Share BAE systems seemed to be more lucrative because of a higher dividend yield and strong financial fundamentals. BAE systems have stronger fundamentals, but its sales are declining over the years when compared to Rolls-Roice. As a result, the firm’s debt capital has been increasing over the years. On the other hand, Rolls-Royce revenues have been increasing over the years. This indicates that the profitability of the company is increasing. The level of income has increased by 9% since the over the last three years.
Evaluation of Business Performance using Non-financial Measures
How business success is measured in Rolls-Royce
Rolls-Royce is a multinational company. Therefore, success cannot be quantified regarding money only. Instead, other factors such as customer satisfaction, increased customer loyalty, employee satisfaction among others should be considered when determining if the firm is creating value (Fernández, 2013). In Rolls-Royce, the key performance indicators include financial metrics such as earning per Share (EPS) and sales growth. On the same note, non-financial metrics such as loyalty, product quality, employee satisfaction and business longevity is considered (Van Dooren et al., 2015).
Roll-Royce Plc has a hierarchical organization structure. The company uses this structure because of the fact that the method is effective to supervise and develop the firm. The company is developing in a series of layers from the bottom to the top. The top layer of the organization encompasses of the management and makes decisions concerning the organization operations and policy making.
Organization Structure
The internal operation is managed based on different structures and departments. Decisions are made on top and disseminated from the top downwards. There is a Customer Facing Business Units (CFBU) on the top followed by different manufacturing and purchasing Operating Business Units (OBUs). There are different Operating Business Units such as civil and Aerospace, defense unit, the marine unit and the energy unit.
The main role of the CFBUs is to identify new opportunities for the organization and dealing with customers in the markets. On the other hand, the OBUs are responsible for manufacturing the different products by designing, developing and manufacturing the components of the different machines.
Performance Evaluation
Performance evaluation is important as it helps management and employment to work as a team in an effort to increase the performance of employees through mentorship, training, and goal setting for each employee. In Rolls-Royce performance management and evaluation is done based on five areas. The areas include;
Productivity: Rolls-Royce always set goals for each employee and performance is evaluated by assessing the way employees have performed to ensure that each employee maintains consistency in quality. The processed data are often reviewed by a panel of senior associates in Rolls-Royce from time to time (De Waal, 2013). Employees who perform well are motivated to perform even better while those employees who are not performing exceptionally are encouraged through a reward punishment system.
Communication skills: employees are also evaluated based on communication skills. The management of Roll-Royce believes that communication skills are important for communicating with each other and the management. In so doing, employees will be able to share their views, provide suggestion and perform their roles better. The management, therefore, concentrates on enhancing communication skills for their employees.
Innovation and initiative: The management always believes that innovation is the core concept that drives the aviation and defense industry. Therefore, they always encourage employees to share their ideas concerning how they production and work process improve. Therefore, employees are also evaluated on their innovativeness and creativity that help achieve business sustainability.
Rolls-Royce uses balanced scorecard as a key strategic communication mechanism. The management uses the Balance-scorecard as a control system for improving employee performance. Management uses the balanced scorecard to improve communications, evaluate performance in relation to organization goals, and finally align business practices with the vision and strategy of Rolls-Royce (Kaplan & Atkinson, 2015). Rolls-Royce also uses balanced scorecard as a non-financial performance metric to give the management a better view of organization performance. Roll-Royce uses the balanced scorecard as a performance evaluation metric in the following areas;
Internal business process performance: Roll-Royce uses the balanced scorecard to evaluate internal business to ensure that goods are produced at a high productivity rates, timeliness, and quality measurement.
Customer value performance: Rolls-Royce uses the balanced scorecard to evaluate customer perception about the firm. Some of the key metrics evaluated include customer satisfaction, customer loyalty, and market share (Northcott & Ma’amora Taulapapa, 2012).
Financial performance: Roll-Royce uses balanced scorecard in conjunction with financial metrics for guiding and evaluating the company on planning the future based on the story of the past events. Some of the key metrics for evaluating financial performance include return on capital, earnings, and cash flow.
Responsibility Centers and performance evaluation
Managers at each responsibility centers within Rolls-Royce are responsible for managing various activities and are also bestowed the authority to Prepare a responsibility report requisite for evaluating the performance of their centers. Responsibility reports help in measuring cost, revenue, and profit centers by comparing the center’s budgeted performance with the set performance. On the same note, the responsibility reports measures and interprets individual reports.
When evaluating revenue centers’ performance, managers only consider the revenues in responsibility center and ignore other things. Evaluations on revenue centers focus on sales within the revenue centers. The cost centers are the areas where goods and services are produced and offered to other parts of the firm. These centers have controls over the prices of goods and services. Therefore, managers in the cost centers use total cost to evaluate performance. The cost center is important for monitoring the quality of goods produced by the firm and thus important for improving performance. Finally, in profit centers, managers have the responsibility and accountability for managing both revenues and expenses. The managers in profit centers also have the freedom to select what to purchase or offer for sale. Similarly, managers in these profit centers also have the ability to set their prices for goods and services of the firm. Performance in profit centers is evaluated using controllable margins. Costs and Revenues that are controllable are considered. On the other hand, costs that are beyond the manager’s control are excluded from performance evaluation.
Evaluation of Business Performance Financial Measures Conclusion
The aerospace and defense industry is dominated by two main companies in the United States. That is BAE Systems and Roll-Royce Holdings. These firms produce armored vehicles, airplane engines, and marine ships among other machinery used by the military. Similarly, the two companies also produce airplanes, motor vehicles and communication systems for commercial use. This industry has been quite profitable for the last three years. BAE Systems has strong fundamentals in terms of capital structure, and its profitability ratios indicate that the firm has been profitable over the years.
However, BAE Systems profitability has been decreasing. This is because BAE System produces mainly defense equipment and system. The demands for products in the defense sector have reduced because of reduced military spending in the BAE primary markets the United States and Europe. Roll-Royce profitability has been increasing even more as compared to BAE System. This is because the Roll-Royce productivity has been increasing. Similarly, income levels for Roll-Royce have increased by 9% since the year 2012.
BAE System is efficient in managing its resources as compared to Rolls-Royce Holdings. This implies that BAE Systems is more efficient in using resources to produce finished products ready for sale. However, when it comes to liquidity, Roll-Royce is more liquid as compared to BAE Systems.
Due to decreased sales, BAE Systems debt has been increasing. In the year 2014, the debt capital was 90% of the total capital. However, BAE Systems still offer high dividends to its shareholders. However, the profitability of Roll-Royce has been increasing with time. As a result, the price Rolls-Royce shares has been increasing and becoming expensive as compared to BAE System shares.
Rolls-Royce also uses non-financial performance metric to evaluate the performance of the organization. Some of the key sectors of interest include quality, improvement of communication and interpersonal skills, innovation, improvement in customer relations among others. The organization uses balanced scorecard for strategic management and to assist in aligning organization goals. Therefore, the two firms are competitive enough and eligible to work on the drone technology. This is because they possess the requisite resources, and manpower.
Evaluation of Business Performance Financial Measures Recommendations
Investors often make decision whether to invest on a company after doing fundamental analysis and market analysis to determine the profitability and strength of a company. A company that is worth investing in should be profitable, efficient in converting raw materials to finished goods, have enough cash flow to handle day to day operations and finally, have a good future outlook.
Therefore, BAE Systems should find ways to improve its capital structure. The firm is financed more by debt, the firm’s debt amount to about 80% of the total capital. Therefore, BAE Systems should develop strategies to reduce the amount of debt. This can be achieved by reducing debt financing and raise capital through equity financing. The firm should use its shares to finance the business operations and reduce the amount of capital acquired through bonds, and bank loans. Similarly, it is recommended that BAE System should reduce the dividends paid to the shareholders and use a larger amount of profits in investing.
Secondly, BAE Systems should also diversify its product range, the demand for BAE Systems primary products which include military machinery. The demand for these markets has reduced in the primary market for BAE Systems that is; the United States of America and the United Kingdom. Therefore, the firm should diversify its products to minimize risks.
On the other hand, Rolls-Royce seems to be performing well. Its profitability has been improving, and this is evident from the persistent rise in share prices. However, the firm should capitalize on improving its internal efficiency to improve its operations even better. These can be achieved by cutting down costs in the cost center. Using a more flat organization structure, to speed-up business operations and finally improving in the supply chain and logistics.
However, both firms have the requisite resources and technology to be part of the team to explore future benefits of drone technology.
Evaluation of Business Performance Financial Measures References
Müller, J. (2014). Rolls-Royce plc. A Company’s Valuation on the Basis of 2013’s and Historic Financial Reports and Figures.
Schmeisser, W., Mohnkopf, H., Hartmann, M., & Metze, G. (2014).Innovation Performance Accounting. Springer.
Gopalakrishnan, K., Yusuf, Y. Y., Musa, A., Abubakar, T., & Ambursa, H. M. (2012). Sustainable supply chain management: A case study of British Aerospace (BAe) Systems. International Journal of Production Economics,140(1), 193-203.
Brigham, E., & Ehrhardt, M. (2013). Financial management: Theory & practice. Cengage Learning.
Fernández, P. (2013). Company valuation methods. Available at SSRN 274973.
Chen, S. S., & Wang, Y. (2012). Financial constraints and share repurchases. Journal of Financial Economics, 105(2), 311-331.
Collier, P. M. (2015). Accounting for managers: Interpreting accounting information for decision making. John Wiley & Sons.
Brealey, R. A., Myers, S. C., Allen, F., & Mohanty, P. (2012). Principles of corporate finance. Tata McGraw-Hill Education.
Van Dooren, W., Bouckaert, G., & Halligan, J. (2015). Performance management in the public sector. Routledge.
De Waal, A. (2013). Strategic Performance Management: A managerial and behavioral approach. Palgrave Macmillan.
Kaplan, R. S., & Atkinson, A. A. (2015). Advanced management accounting. PHI Learning.
Northcott, D., & Ma’amora Taulapapa, T. (2012). Using the balanced scorecard to manage performance in public sector organizations: Issues and challenges. International Journal of Public Sector Management, 25(3), 166-191.
Appendix
Rolls-Royce Profitability Ratios
(Data retrieved from Financials.morningstar.com, 2016)
Rolls-Royce Efficiency Ratios
(Data retrieved from Financials.morningstar.com, 2016)
BAE Systems Profitability Ratios
(Data retrieved from Financials.morningstar.com, 2016)
BAE Systems Efficiency Ratios
(Data retrieved from Financials.morningstar.com, 2016)
Requested deadline Friday 2/12/16 must be at least 5 pages, which doesn’t include title & reference pages, using APA formatting. Each paragraph should contain at least 4 sentences and should not end with citied material ex. (Franklin, 2015.) Each paragraph MUST have supporting information from the reading assignment, for this assignment review weeks 3-5.
I am including the actual assignment from the course as well as the headings required, the chosen company is Wells Fargo. Please use the following to access South University’s as all information must be supported by the weekly lecture & text reading (located under the syllabus tab) as well as the school library. Lecture readings from weeks 4. INTERNET SOURCES ARE NOT ACCEPTED. Feel free to contact me at 334-201-0479 I have also included the grading criteria.
https://mycampus.southuniversity.edu/portal/server.pt
User Name – tiffany_shakepeare
Password – Pr@1seH1m
Once you have logged in successfully you have to click launch class and then click the academic resource tab to access the library. When you click the syllabus it will give you access to the weekly lectures & text readings.
Please remember ALL references must come from these areas.
Please see attached document for required headings. **Reminder each section must be supported by information from the assigned readings weeks 3-5.
SAMPLE ANSWER
Introduction
In order for an organization to achieve its objectives within a business environment, it is essential that some elements are considered. These elements include the manner in which the organization develops a culture of governance through leadership and how these leaders communicate within the organization (Feizabadi, Hamidi, Khatibzadeh, & Ghamati, 2011). This paper therefore aims at determining the manner in which leadership approaches are incorporated within the functions of Wells Fargo and the effectiveness of communication in achieving the organizations goals.
Communication Structure
According to week ones materials, communication is a very important aspect in organizations in leadership of teams. According to the course material, communication is ascribed as the process through which information is exchanged and understood by two parties or more with the intention of influencing or motivating a behavior (Schmitz, 2016). In order to improve the element of communication within a workplace, it is essential for the managers to be aware of the elements that influence the manner in which people communicate.
Managers therefore have the sole responsibility of gathering information from both the inside and outside of an organization and dispense this information within the organization. The manager’s approach therefore seeks to divert the attention of the entire organization towards the values, vision and the desired goals of the organization with the aim of influencing the employees to act in a manner that ensures they achieve their goals (Schmitz, 2016). In this, it is therefore essential to determine that the managers remain the main facilitators of strategic conversations through the inclusion of open communication that actively listens to the views of others, asks relevant questions and provides feedback to learning and change.
This is the case at Wells Fargo where there is a communication structure put in place. Wells Fargo has employed a decentralized approach to communication that allows the workforce to freely communicate with other team members with the aim of meeting a goal (Schmitz, 2016). This approach therefore allows the members to process information amongst themselves until they reach a consensus and is considered an effective approach especially in work environments where work mates needs free flow of communication within each department.
According to the class notes provided on week four, Schmitz (2016) supports the fact that in organizations where the communication network is not centralized, employees have the free will of passing information at ease. However, with the decentralized communication approach as depicted in the case of Wells Fargo, all the employees are involved in the process of communication, a factor that sees the organization arrive at a mutual decision that binds all of the work teams. Wells Fargo therefore incorporates other communicational channels such as the inclusion of short messages, face-to-face communication and phone conversations among other channels. This has enabled the company be achieve its organizational goals irrespective of the fact that there are barriers and hindrances to communication within the organization.
Influence of Culture
It is essential to determine that cultural values are a vital element within an organization and are blended with the company’s environment, goals and strategy. According to the notes, the right fit between an organizations culture, strategy and the environment are associated with different cultures (Schmitz, 2016). In this case, it is essential to determine the fact that culture determines the personality of an organization and is comprised of the values, beliefs, norms, assumptions and tangible signs of an organization members including their behaviors.
Wells Fargo therefore believes in a culture of developing caring mindsets to life whether the company interacts directly with the clients or works with them behind the scenes. This culture has therefore influenced the manner in which the employees carry out their functions, a factor that has seen the organization meet its goals (Schmitz, 2016). Culture additionally shapes the manner in which employees relate and communicate with each other within the work environment with this enhancing the skills of the employees.
Barriers to Communication
Sources from the class noted depict that there are several barriers to communication a factor that is prevalent at Wells Fargo and other organizations. Ignorance from some members of the workforce has been one of the barriers to communication that has seen the organization largish behind in the achievement of its goals (Pozin, 2012). Employees within this organization are in disposal of valuable information that can improve the productivity of the entity but fail to share such information.
Language barrier is additionally another barrier to communication in this company. Considering the fact that the workforce in this company are of different cultural backgrounds, the element of communication tends to become a challenge to them, a factor that decreases the productivity of the company (Pozin, 2012). The class notes delivered in Week 4 clarifies that Managers need to develop an environment that enhances the element of communication. This has seen Wells Fargo develop an open bounder less approach to communication with the aim of breaking the barriers that stand on communication.
Methods to Overcome Barriers
The fact that there are barriers to passing information does not mean that it is over for an organization. The leadership in Wells Fargo should ensure that all barriers to proper communication are managed efficiently (Pozin, 2012). An instance of this can be seen through the inclusion of symbols to ensure that the element of language barrier is dealt with effectively. Training of employees is another approach of ensuring that some of these barriers are dealt with successfully. Training the employees on the importance of attaching value to any obtained information would be very useful in doing away with a barrier to communication such as ignorance. With this, all information passed among the workforce will be received with seriousness thus fostering effective communication.
For the purpose of overcoming communication barriers, the leaders should select appropriate communication channels to incorporate within the functions of an organization. The selection of a communication channel can be done through an analysis of the advantages and disadvantages associated with each communication channel. Schmitz (2016) states that there are both the positive and negative aspects of each method selected in passing information. Additionally, the leaders should grow a strong understanding of givers and takers in the organization. In one study, Grant determined that the single biggest predictor of a team’s effectiveness was the amount of help and support that members gave to one another’.
Leadership Style Analysis
At Wells Fargo, servant leadership exists. This is a type of leadership where the workforce feels the leader is not all about him, but focuses on the interests of the employees. According to the materials offered in week one, the element of servant leadership operates in two dimensions. The first entails the fulfilment of the goals of the subordinates and their needs with the aim of meeting the larger purpose of an organization. Secondly, servant leaders are the givers of power, recognition, ideas, information and credit for the accomplishment of goals and objectives. The servant leadership approach in Wells Fargo has been brought about by the leaders who value team work (Pozin, 2012). This has been useful in fostering a positive response from the workforce. The servant leaders in wells Fargo believe that the workforce has to benefit from other aspects apart from remuneration.
Types of Leaders within the Organization
Different organizations apply different leadership styles in achieving their organizational goals. In Wells Fargo, it is significant to note that there are different leadership styles employed. Many of the leaders within this organization are considered as servant leaders who work for two primary reasons that include fulfilling their subordinate’s goals and achieving the bigger picture of an organizations purpose (Pozin, 2012). Servant leaders are known to give things away such as information, power, ideas, and so on.
Additionally, at Wells Fargo, there are authentic leaders as well who are known as people have an understanding of their selves and who act in consistence with ethical values within an organization. On the other hand, these leaders’ also have the capacity to inspire others with their authenticity and openness with this inspiring commitment, trust, and respect in organizations (Pozin, 2012). It is worth noting that the authentic leaders end up motivating the workforce through their openness. The servant leaders end up motivating the workforce through showing that it is good to work as a team. Authentic leadership is known to bring about trust and commitment in a company.
Level of Trust within the Organization
Wells Fargo has been able to witness commendable positive strides in terms of trust. The presence of the authentic leaders has been able to develop such trust. This has led to more commitment from the workforce. With such trust, the flow of communication has been effective, something that has contributed positively to the operations of Wells Fargo (Grant, 2013). The human resource management in the organization has also assisted in the high level of trust in the organization. This has been through the management of talent in the organization. This has been an important thing since the human resource management has led to a high level of competitive success of the company.
Recommendations for Improvement
All organizations are supposed to ensure that they improve in communication and leadership. Wells Fargo needs to broaden the scope of its communication structure. Any weaknesses should be done away with to allow efficiency to grow in the communication structure. The leaders should ensure that all communication channels are made better and efficient. Regarding language as a communication barrier, Wells Fargo should create symbols for the organizations to pass some important information. The leaders should also improve on their leadership styles to ensure that the level of trust is made stronger.
Recommendations for Motivating the Workforce
All organizations should ensure that the employees are fully motivated. Motivation of employees refers to boosting the morale necessary for achieving a certain objective of an organization. Therefore, the workforce at Wells Fargo needs to be motivated for better results. The management at Wells Fargo needs to use compensation as the major method of motivating the workforce. The company should be able to pay good perks to the employees for work well done. The salaries of the employees should also be reviewed regularly for the employees to feel valued thus motivating them. Wells Fargo should also improve the working environment for the workforce.
Feizabbadi, Hamidi, Khatibzadeh & Ghamati (2011) purport that the environment remains essential for human beings at work. A team will end up getting motivated when the environment at the company is improved. Additionally, Wells Fargo should consider the use of the equity theory. Equity theory states that the workforce gets motivated when they feel that there is equal treatment by leaders. Therefore, Wells Fargo should treat its employees equally for the purpose of motivating them. The goal setting theory can also be helpful to Wells Fargo. This theory of motivation states that the workforce can be given specific interesting goals to pursue with the management participating in checking progress, something supported by Pozin (2012) by saying that if you want happier employees get rid of the bosses.
Conclusion
The decentralized communication structure employed by Wells Fargo has been able to improve the trust in the organization. It is advisable to have the management of the company keep on reviewing the structure in place. The leaders should be able to put in place ways of removing the barriers to proper communication (Pozin, 2012). The servant leadership style at Wells Fargo should be improved continuously. The fact that trust has been high in Wells Fargo does not mean it is sufficient; more trust should be sought and maintained.
References
Feizabadi, M.S., Hamidi, M., Khatibzadeh, M. and Ghamati, H. (2011). A survey of the relationship between job stress and the quality of life in sport teacher in Mashhad City. Retrieved from http://ac.els-cdn.com/S1877042811029399/1-s2.0-S1877042811029399 ain.pdf?_tid=28dca252-ceeb-11e5-97550000aacb361&acdnat=1454994690_3207d5f808abff2c0aaa06cc3fe3bb94
Grant, A. (2013). “Givers Take All: The Hidden Dimension of Corporate Culture,” McKinsey Quarterly, Issue 2 (2013): 52–65; and Grant, “Turning the Tables on Success.” 44.
Pozin, I. (2012). “The Takeaway: Three Things That Motivate Employees More Than Money,” Inc. (February 2012): 6.
A portion of the Ajax project has five tasks we are tracking with EVA. Here is the status for this work period for those 5 tasks:
TASK 1.5
Task- 1.5.1 was budgeted at $755, so far we have spent out the door $824. I understand that it is 80% done. This is the end of the 3rd week and it was supposed to be done in five weeks.
Task- 1.5.2 is 25% complete one full week into a 3 week task. The budget says $1,250 for this one. We are out of pocket $800 so far for this puppy.
Task- 1.5.3 was done at the end of last reporting period. The planned 5 week time period for the task has passed. It was actually completed it 2 weeks early! The budgeted amount was $675, but it actually cost us $890 (Maybe that was why it went so fast -overtime?!.)
Task- 1.5.4 is 25% complete one full week into a 3 week task. The budget says $1,125 for this one. We have spent so far I’m told $790 for this guy.
Task- 1.5.5 has not started yet. We are about four weeks before we can start that one. It is budgeted at $2550 and a duration of 3 weeks.
Some questions for you
1. Using EVA what are the PV, EV, and AC values for each Task and for the entire TASK 1.5 effort to date?
2. What are the SV, CV, SPI, and CPI values for each Task and for the entire TASK 1.5 effort to date?
3. What is your overall assessment for this effort at this time?
SAMPLE ANSWER
Introduction
According to Philipson & Antvik (2009) for many companies that are focused on improving project performance, there seems to be a lot of emphasis on earned value analysis (EVA) as the most crucial logical technique for utilization on projects with an aim of getting a better understanding and management performance. This is attributable to the fact that, in these techniques procedures are well written and there is also provision of some training (Project Management Institute, 2013). Humphreys (2011) reiterates that project managers’ use earned value analysis, with an expectation of the project management results will soon improve significantly.
Marshall (2014) reiterates that earned value analysis is considered to be an industry’s standard way for the measurement of a project’s progress, forecasting its completion date and final cost, and providing schedule and budget variances along the way. As a result, through integration of three measurements, it provides consistent, numerical indicators with which you can evaluate and compare projects (Abba, 2012; Devaux, 2014).
Defense Systems Management College (2007), note that the approach of earned value analysis is used to measure the extent to which the project work has been completed in a project with regards to each task at given point of performance and time. This analysis is often carried out through calculation of how much time, the work has taken as well as the resources that have been used, and the values obtained for both resources and time are compared to the planned values in order to determine whether the project is running ahead or behind schedule (Fleming & Koppelman, 2005). Similarly, the earned value analysis is also used to determine whether the resources utilized are more than initially planned, meaning that the project management has not been efficient with regards to resources (Fleming & Koppelman, 2005; Goodpasture, 2004). Formally, Earned value analysis may be defined as a tool to objectively measure project performance by integrating scope, time and cost data. Earned value management also provides a means to forecast future performance based on past performance (Goodpasture, 2004).
This report will provide an analysis of earned value based on key formulas and key metrics essential for the monitoring of a project when using earned value analysis. This will be in addition to a consideration of the common errors encountered in implementing EVA and corrective actions that are appropriate. An informed conclusion will be arrived at based on the carried out analysis from the perspective of EVA concepts and principles as well as project performance metrics, which is a cornerstone of earned value management.
Questions (Calculated values are within the PowerPoint file)
Using EVA, the PV, EV, and AC values for each are shown in the PowerPoint presentation. In addition, the SV, CV, SPI, and CPI values for each Task are also shown in the PowerPoint presentation. Furthermore, an overall assessment for this effort at this time based on the calculated performance metrics show that the project is not well managed. For instance, the schedule and cost efficiency of all the four tasks is relatively not very good whereby only Task 1 and Task 2 are ahead of schedule; while both Task 2 and Task 4 are behind schedule. All the four tasks are over budget with relatively large margins indicating that the actual costs for all tasks were above the planned values. SPIs show relatively good efficiency for schedule with ratio ranging from 0.67 to 1.33, while CPIs terrible cost efficiency with ratios of 0.73, 0.39, 0.76 and 0.36 for Tasks 1, 2, 3 and 4 respectively.
Conclusion
In conclusion, it is undoubtedly evident that earned value analysis can be used to analyze the progress of a project in order to succinctly know how effectively it is managed with regards to schedule (time) and resources (cost). This provides a comparison between the planned values and the actual values in order to gauge the extent of efficiency in project management. For example, the values obtained in the Ajax project show that the extent of efficiency was relatively not very good both in terms of time and resources. However, its implementation was still with an achievable range.
Defense Systems Management College (2007). Earned Value Management Textbook, Chapter 2. Defense Systems Management College, EVM Dept., 9820 Belvoir Road, Fort Belvoir, VA 22060-5565.
Devaux, S. A. (2014). Managing Projects as Investments: Earned Value to Business Value. London, UK: CRC Press.
Fleming, Q., & Koppelman, J. (2005). Earned Value Project Management (3rd ed.). Newtown Square, PA: Project Management Institute.
Goodpasture, J. C. (2004). Quantitative Methods in Project Management. J. Ross Publishing. pp. 173–178.
Humphreys, G. (2011). Project Management Using Earned Value. Newtown Square, PA: Humphreys and Associates.
Marshall, R. (2007). The Contribution of Earned Value Management to Project Success of Contracted Efforts. Journal of Contract Management, 2007, pp. 21-331.
Project Management Institute (2013). A Guide to the Project Management Body of Knowledge. Newtown Square, PA: Project Management Institute. 2013. pp. 217–219.
Philipson, E., & Antvik, S. (2009). Earned Value Management: An introduction. Philipson Biz.
Project Management Institute (2005). Practice Standard for Earned Value Management. Newtown Square, PA: Project Management Institute.
Solomon, P., & Young, R. (2006). Performance-Based Earned Value. New York, NY: Wiley-IEEE Computer Society.
Stratton, R. (2006). The Earned Value Maturity Model. New York, NY: Management Concepts.
We can write this or a similar paper for you! Simply fill the order form!
Report on two companies and their related histories within the same line of business.
Pick two competing companies, one of which is successful in their line of business and one who hasn’t been successful in recent years. Identify the role technology played in both companies. Your comparison must thoroughly examine the entire role that technology has played. This should address the following points for both companies:
•What part of the business do you consider to be the primary technology? (for example in a computer company it may really be the software bundled with the computer that provides the competitive edge or in the pizza business it may really be a novel method of delivery which is the distinguishing innovation that establishes a competitive edge).
•What type of strategy did each company employ? Did they take an offensive role or defensive role? How did their strategy affect the outcome of their success? Was there an impact on the entire industry as a whole?
•Report on whether each company performed internal innovation and if so, how was this accomplished? If they didn’t use internal innovation – describe their methodology. What was the management’s role in fostering the incorporation of the innovation?
Finally, you are expected to provide an analysis of both the strategies, recommendations and a conclusion.
SAMPLE ANSWER
In the telecommunication industry, just like any other industry, technology is regarded as a prerequisite factor to business success. Apple Inc and Toshiba are two of the main telecommunication companies in the world. The rise in the need for more improvised devices by the consumers give the companies need for technological advancement. It takes use of expertise innovations to remain competitive in the industry. The more diverse and innovative a company is the higher the chances of getting more income. Apple Inc has managed to increase its profitability over the past five years while Toshiba Company has had its net income reduce over the years. Technological strategies employed by both companies have been the differentiating factor regarding their success levels.
Role of technology
Technological capability is the knowledge and skills needed in the identification, appraisal, utilization, and development of techniques required for business success. In this digital era, innovation is essential for competitive sustainability. In business term, innovation means doing something differently concerning productivity, value, or quality by use of emerging or already approved technologies in the world (Abid 2015). Recent technological innovations including online shopping, digital marketing and communication, and social networking are some of the technological changes that have largely affected telecommunication industry. Effective business planning, marketing, and technological strategies have been employed by leading companies in the industry.
Primary technology
Over the years, Apple Company has largely invested in technology and choosing innovation to increase its market share, financial growth, and overall competitiveness. The company has used technology to differentiate its products and reach out to more consumers. It uses digital technology to gain a competitive edge through advertising and extensive promotions. The company has differentiated its products by launching products such as iOS to maintain consumer loyalty (Leo 2015). Its team of skilled personnel keeps changing the design and use of its products according to consumer specifications. Apple’s primary technology is the production of unique customized products. The products have an appeal that is specific to consumer needs making the rivals unable to copy the products. Apple uses devices that use iOS while its rivals use Google.
Toshiba Company pursues a competitive edge in the telecommunication industry by offering diverse products in electronics, digital products, social infrastructure, and home appliances. While its rivals mostly concentrate on intensive paper verticals such as legal and education, Toshiba has differentiated its innovative strategies by focusing on retail, logistics, and manufacturing. Unlike Apple Company, which has a high market in cell phones, Toshiba is widely known for its office printing devices and computers. The company’s primary technology lies in POS systems which have essentially differentiated it from other market rivals. Toshiba computers are known to be of high quality and also durable (Minita 2014). However, due to the innovative changes on phones by companies such as Apple, computers are increasingly losing their demand. Some phones produced by Apple have the substitute form of a computer, and their portability makes their demand rise on computers.
Company strategies
Companies use either defensive or offensive strategy to compete in the market. A defensive strategy is said to be reactive. A company develops a defensive strategy to protect its market share, profitability, and position. An offensive strategy involves the use of aggressive and direct competition. Companies that rely on aggressive strategy invest highly in research and development and technological innovation.
Apple has used both defensive and offensive competitive strategies in some ways. Through the application of information technology, the company used advertising to campaign for its PC and highlighted the product features which in essence made the products made by other rivals inferior. The result was an increase in competition edge for Apple and an increase in revenue. The campaign was made after other rival companies introduced their products but Apple strategized by increasing its product features to curb the competition.
Another use of defensive strategy by Apple was in the introduction of iOS. The introduction of a new product is a defensive strategy that if well utilized can lead to optimization of the competitive edge by the resulting company. Through the use of media, the company was able to launch the devices and attract a substantial number of loyal customers. The devices are not only appealing to consumers but are one in a kind. They are not found in any other outlet apart from the Apple stores, and this gives Apple an upper hand until the competitors can copy the design (Leo 2015). The launch of new products that are custom-made has seen the share value of Apple rise above the industry average.
On the other hand, Toshiba has applied defensive strategies through extensive advertisement of its products that are of high quality. Most consumers buy Toshiba products due to their appeal and quality. Another way the company has hedged the competition through defensive strategies is lowering of its product prices compared to its rival Apple. Low price for its products and consistent quality has enabled Toshiba products to remain in the market for a long time.
Toshiba has tried to increase its market share by trying to reach out to specific operating sites that the real users are. The company has tried to establish a market in retail stores, warehouses, factory floors, and distribution centers. The company applies information technology in the diversification of its market to the four operational stores. Through E-commerce, the company has been able to establish a relationship with more customers in the retail and distribution industry. The result has been increasing in sales revenue which and an improvement in profitability.
Being a market leader in POS system, Toshiba Tec has used its global awareness to enhance its operations. The company has used technology in inventing a paper re-using system which allows toner to be printed on and erased from the temporary papers (Minato 2014). The re-using system enables customers to recycle papers and save on operational costs. Since most businesses are focused on increasing profits at a reduced cost, the invention of the re-using system was a good initiative that captivated the users. The product was uniquely designed and penetrated a new niche in the market for the company. The new technology in printing business led to an increase in revenue for Toshiba Company.
Toshiba has used technology to social responsibility. In 2013, the company was able to launch MFP system that can be used together with the re-usable paper. Use of the MFP system saves customers cost as well as avoid degradation of the environment. The system also enables power saving and print management. The strategy is both offensive and defensive. It is defensive since it’s a new product in the telecommunication industry and offensive as it renders competitor’s devices less attractive to the consumers.
Analysis
Companies employ a specific strategy to increase their competitive edge. Use of defensive and offensive strategies by Apple and Toshiba through the launch of new products and product features intensifies the competition in the industry and makes less competitive company go out of business. Also, the strategies lead to more product differentiation, price wars, and increase in product quality. Consumers are always the beneficiaries in either of the strategies (David 2014). The strategies have heightened the competition in the telecommunication industries, and more capital is being set aside for research, development and technological innovations.
From the strategies employed by both Apple and Toshiba, it is clear that technology has been paramount ensuring their survival in the telecommunication industry. Though both of the companies have been highly innovative, Apple Company stands out due to its advancement in recent technological trends that are attractive to modern users. Consumers have increased their demand for telecommunication devices that are multi-purpose, and Apple Company has been able to satisfy them. Toshiba success rate has reduced in the past years since it hasn’t been able to adapt to the new products provided in the telecommunication industry. Although it has technologically been able to differentiate its products, it has been outdone by Apple in innovations.
A company maximizes its competition through the use of both external innovation and internal innovation. External innovation is applied to the product and the outer market while internal innovation comprises of changes in the internal structure of an organization (David 2014). Apple and Toshiba both used information technology to make changes to their business processes to cut costs, increase product quality and efficiency, as well as increase customer satisfaction.
Instead of increasing production capacity and storing inventory in the production houses, Toshiba merged with other retail outlets and distribution centers to decrease customer delivery time and stock holding time. Apple innovated its internal functions by the production of custom made devices and incorporation of customers and experts in the design of its products. The company also maximized vertical integration of its internal processes to cut costs and improve on quality.
The role of management in the incorporation of the internal innovations was to ensure all the departments were integrated, and every member of staff was focused on the goals of the organization. The management also ensured employees are motivated by giving them the freedom to express their views on innovations as well as give advice on how they would like the company to be run. Expertise skills were needed in making the innovations, and it was the management role to recruit competent staff for the jobs and merge the needs of the shareholders to the strategies.
Effective competitive edge is realized through the application of both defensive and offensive strategies in a controlled manner. Since the telecommunication industry is rapidly changing, it requires the players to remain alert for new changes and means to outdo its rivals. Apple Company has established a niche in the telecommunication industry through the application of various technological strategies. The company has widely relied on digital and information technology to differentiate its products and launch unique products. Through extensive campaigns and advertisements in the media, the management of Apple Company has been able to reach out to customers and produce products that are appealing to the market (Laudon 2016). The company has taken advantage of its brand name to launch new products that have increased its sustainable competitive edge.
Toshiba has applied technology by diversifying its products. The company which is mostly known for the provision of office printing services invented Barcode printers which provide multiple purposes to the consumer. MFP and re-usable paper systems are some of other technological innovations that Toshiba Tec has applied to bridge the competition gap. The products are cost saving and environmentally friendly (Minato 2014).
Recommendations
The strategies employed by each company were different but effective as per the goal of each organization. Since the two companies are in the telecommunication industry, it is clear that Apple is more aggressive in its innovations, and that’s why it has a higher market share than Toshiba. Though Toshiba has a wider product base, Apple’s revenue is high due to the high demand of its products compared to Toshiba.
Since competitors wait for a innovation so as to improvise and outdo the original inventor, Apple should maximize on its unique products by ensuring the products offer comprehensive satisfaction to the customers and also ensure it keeps introducing new products. The company highly depends on iPhone, which is a weakness that can be exploited by competitors. On the other hand, Toshiba should focus on how to improvise its products to fit the demand of the consumers, especially in the digital sector.
Conclusion
Though Apple and Toshiba are in the telecommunication industry, their differing strategies have bridged their profitability gap. Apple offers unique products that are appealing to the consumers through the use of information technology. Extensive advertisement in the new media platforms has increased the company’s market share and profits. Toshiba heavily relies on office printing devices and computers which gave Apple the opportunity to launch new products and take over the market. Technology is paramount to the success of any company especially in the modern digital world (Laudon 2016).
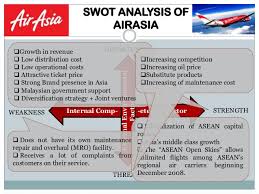
Air Asia which operates globally entered the aviation industry as a low cost airline and it is headquartered in Kuala Lumpur, Malaysia. Its operations are through scheduled international and domestic flights and it is without any doubts the largest low fare airline in Asia and operates without frills which distinguish it as the pioneer of low cost flights in Asia (AirAsia, 2016a). According to AirAsia (2016b) AirAsia’s operations are mainly based at Kuala Lumpur International Airport (KLIA) within the Low Cost Carrier Terminal (LCCT) and it has other affiliate airlines either as subsidiaries or joint ventures such as Thai Air Asia, AirAsia X, Philippines’ AirAsia Inc., AirAsia Japan, Indonesia Air Asia and AirAsia India. The later airline i.e. AirAsia India, which is a subsidiary of AirAsia is the subject of discussion in this report.
The original founder of AirAsia was the Malaysian government, which established the airline in 1993 and it was later bought by Tony Fernandes and partners Pahamin Rejab (former AirAsia’s chairman), Aziz Bakar and Kamarudin Meranun on 2nd of December 2001 (AirAsia, 2016a). AirAsia has aggressively continued to spread out low cost travel through the management’s efficient, passionate and innovative approach to its current status whereby it has a route a network extending through more than 20 countries (AirAsia, 2016c).
Nowadays, AirAsia now is undoubtedly one of the largest low-cost and award winning airlines in the ASEAN and its growth and operations are expanding rapidly in the region. It airline started with a primary goal of ensuring that it frees air travel as well as making it so affordable to travel through the air in order to ultimately make sure that “now everyone can fly”. Currently, the airline as a whole operates a fleet consisting of 90 short-haul, medium-haul and long-haul aircrafts flying to over 60 destinations mainly from hubs in Malaysia, Indonesia, Thailand and India (AirAsia, 2016c). As a result, the airline operates over 3,500 flights on a weekly basis, thus coloring the Asian blue skies bright red alongside their livery striking. The airline also employs about 7,500 staff and within its short period of existence, AirAsia has managed to ferry approximately 90 million passengers to various destinations not only in Asia but also across the world (AirAsia, 2016a).
Objectives
AirAsia objectives are targeted at making sure that that airline’s rapid growth and expansion as well as operational efficiencies are maintained. The objectives are:
To achieve higher cost advantages by continuously reducing cost along its value chain through the analysis of the value chain to create cost benefits.
To establish itself as the leading low-fares and no frills airline in the ASEAN region in order to increase its passenger traffic.
To ensure that it maintains continuous improvements in service delivery as well as expansion of its operations in ASEAN region and globally.
3.0. Strategy and Answering the Key Questions
Business strategy of AirAsia put in place the foundations of the business, and the airline strives to deliver low-cost, no frill, reliable and hassle-free services and flights to its passengers. AirAsia’s low fare model is made possible for creation of values by implementing the key strategies highlighted below:
Strategic Analysis
According to Homburg, Kuester & Krohmer (2014) strategic analysis involves careful assessment of the prevailing conditions that directly or indirectly influence the business in order to identify the imminent challenges or unfavorable factors as well as critical success or favorable factors. As a result, the strategic analysis will involve the PESTLE analysis, Porter’s five forces, value chain analysis and the SWOT analysis (Porter, 2012). The strategic analysis is imperative for a business since it is vital in the identification of critical success factors which AirAsia should leverage on to achieve competitive advantage in the aviation market (Kotler & Armstrong, 2012; Porter, 2013).
PESTLE Analysis
PESTLE analysis is essential in ensuring that there is assessment of the company’s situation in terms of politics, economics, socio-cultural factors, technology, as well as legal and environmental factors aimed at determining a company’s long-term plans (Barney, 2011; Baker, 2013). Thus, the discussion will consider political, economic, social, technology, legal as well as environmental factors as discussed in the section that follows below.
Political
Politically, it was without any doubts difficult to fly within the ASEAN region making the airline to undertake a process of addressing the main barriers towards low cost travel through the double-sided agreement. According to Saha & Theingi (2013) in terms of politics, the landing charges are also envisaged to be a significant factor that will influence low fare airlines charges. There are also other political factors that influence AirAsia operations in India including: government support for the national airline carriers within the region, increased charges in the routes by the government; severe security restrictions and measures in the region; threat of terrorism attacks in the region; increased tensions between various countries in the country including Indonesia and Malaysia as well as the newly established “climate protection charge” for the compensation of carbon emission taxes by the aviation industry.
Economic
AirAsia airline plays an imperative role in ASEAN aviation market by offering low-cost flights through provision of inexpensive tickets as well as significant reduction in flight services. Through the cheap fares, the airline is likely to achieve competitive advantage in the market over its competitors irrespective of the economic situation (Kotler & Armstrong, 2012). Other economic situations that characterize the Indian aviation market include fluctuations in the currency, high prices of the petroleum fuels and/or products, economic recessions or sluggish GDP growth rates, the low cost airline industry in India is within the growth rate life cycle and finally the changes in the economy are attributed to variations in lifestyles including increased frequency in flying for vacations.
Social
Socially, the willingness of passengers in the region to take the long-haul flights which are significantly expensive is very minimal. There is also an increase in the global population as well as the middle class both of which have increased demand for air travel in the ASEAN region including for AirAsia (AirAsia, 2016b). Operations within the ASEAN region are also characterized by a variety of languages and cultures, whereby the grey market associated to this phenomenon is attributed to the rapid growth in the company’s operations (Kotler & Armstrong, 2012).
Technology
The availability of advanced technologies for AirAsia have been critical in ensuring that the airline provides online services that are essential at combining air ticketing, travel insurance, hotel bookings as well as car hire. According to Armstrong & Greene (2013) the airline has significantly pushed on the internet booking services in its attempts towards keeping operational costs in check.
Legal
Considering that long haul flights shall be offered by AirAsia Indian through its strategic alliances with a variety of airlines, the potential for expansion of its operations is likely to take place through further partnerships aimed at more liberalization of the services (Reicheld, 2012). Due to the fact that, commercial aircrafts have to fly a variety of countries this means that the greatest legal hurdle is to obtain clearance by the respective territories and/or countries to allow the company aircrafts fly over their skies. Thus, the AirAsia’s external environment is relatively stable as long as there is steady maintenance of the legal environment which is also critical in determining the consumer behavior (Schiffman et al., 2009).
Environmental
The ASEAN region, rapid population and economic growth have been attributed to creation of serious social consequences that have negative influence of the environment including air pollution and global warming. There is a constant increase in the rate of air travel within the ASEAN region as better technologies motivates more customers to travel; and this has been attributed to an increase in the number of issues related to green house gas and global warming effects (Saha & Theingi, 2013).
Porter’s Five Forces
Porter’s five forces is a model used by many companies particularly in their marketing strategy in order to conduct industry analysis as well as corporate strategy development. The model includes five key factors such as competition, supplier strength, customer power, and the potential for new entrants into the market as well as threat of substitute products (Armstrong & Greene, 2013).
Figure 1: Porter 5 Forces diagram
Bargaining power of customers
Buyers’ bargaining power has definite ability to put a company under pressure from its own customers (Saha & Theingi, 2013). There are 2 types of buyer power which are customer’s price sensitivity and negotiating power and price sensitivity by customers are the two main types of buyer power; hence the Revenue Management System was immensely utilized by AirAsia in almost all its operations thereby helping it to react to customer behavior to maximize on income. The availability of seats is availed at various prices in varied points of time and the charging for reservations is done upon the changing of the previous booking time by the customer to later or earlier day (Lamb, 2014; Porters, 2013).
Bargaining power of suppliers
Bargaining power of suppliers is imperative in describing the market input thereby acting for the benefit or detriment of the company (Mulcaster, 2013). To overcome the challenges posed by the high suppliers’ bargaining power, AirAsia adopted a full fledged ERP system to ensure reductions in the financial month-end times for closing processing, retaining process incorruptness, as well as speeding up data restoration and reporting process (Saha & Theingi, 2013)
Threat of new entrants
Threat of new entrants in the market is critical in determining the market profitability subsequently giving high return as well as attracting the new firms (Saha & Theingi, 2013). However, the barrier to entering the airline industry is significantly high due to the high capital required to rent or purchase the aircrafts, hire employees, set up an office etc (Lamb, 2014).
Threat of substitutes
Threat of substitute is attributed to the availability of products that increase the propensity of customers to switch or shift to alternatives and/or options (Saha & Theingi, 2013). The threat of substitutes for AirAsia in the ASEAN region is minimal, including busses, train and cruise due to the geographical factor.
Rivalry among existing competitors
For the aviation industry, the intensity of competitive rivalry is without any doubts the main determinant of the industry’s competitiveness (Kotler & Armstrong, G. (2012). The main competitors of AirAsia Indian in the Indian aviation market are Nacil, Jetlite, Air Sahara, Air Deccan, Jet Airways, Kingfisher, Spice Jet, Go Air, Indigo, Paramount and Jet Konnect. However, through its unique services AirAsia has managed to overcome its competitors to emerge as the leader in low-cost travel airline in the ASEAN region.
Value Chain
Value chain is a critical part of a company’s operations which is involved in converting inputs into outputs in the process of adding to the bottom line and also helping in the creation of competitive advantage in the market (Mintzberg, Ahlstrand & Lampel, 2014). The value chain of a company involves a wide range of activities and AirAsia’s value chain can be mainly divided into two main activities such as primary and supportive activities. The primary activities in AirAsia’s value chain are mainly concerned with logistical issues and usually involve the inbound logistics, outbound logistics, sales and marketing as well as services. On the other hand, the supportive activities in AirAsia’s value chain are usually concerned with the firm infrastructure, human resource management as well as technology. According to Kotler & Armstrong (2012) a balanced combination of these two operational activities which are critical for day to day operations of the company is essential in ensuring that optimal returns are achieved.
Barney (2011) notes that primary activities are without any doubt the most vital in making sure that the operations of a company take place in the respective markets effectively. In particular, the inbound logistics of AirAsia include activities such as appropriate management or progress of flights, keeping an eye on the competitors in the market as well as consistently assessing the ways through which low cost prices can be maintained through fuel efficiency control especially by advance purchase of fuel when the prices are low alongside effective planning of routes (AirAsia, 2016c). Alternatively, the outbound logistics of AirAsia are often carried out through an online platform which is used to enable customers to access online booking in order to get their air tickets. This is highly important because it helps customer to book their air tickets conveniently or print them prior to arriving at the airport (Gregson, 2014; Gronroos, 2014). Additionally, general electric engines are the ones used by AirAsia due to their reliability in order to ensure customer safety mainly because the company prioritizes their customers. AirAsia also has an edge due to its strong brand name which plays a critical role in its marketing strategy because it is attributable to a significant extent of the company success in the Indian aviation market through significant market collision as well as increased sales (Cameron, 2014; Deming, 2012). As a result, due to AirAsia’s marketing it has been sponsoring the mu football club as well as the amazing race tournament. In addition, some of the company’s aircrafts are usually painted with sports stars and club color, while a significant amount of merchandise related to AirAsia including T-shirts and caps are produced every year (AirAsia, 2016c). Services are the other form of outbound activities, and AirAsia is undisputedly involved in the delivery of a wide range of services to its customers such as pre-booking checked baggage at lower rates and offering e-gifts on flights that are delayed more than three hours as well as online medical services, renting a car and booking of hotels (AirAsia, 2016a).
Furthermore, AirAsia’s value chain provides supportive activities for the purpose of making sure that the business remains operational. The airline is not only concerned with offering classic low-cost flights due to its low-cost carrier (LCC) status but also it is advancing into ensuring that it becomes an integrated airline service provider. Thus, AirAsia is usually focused in making sure that it provides cheap fare travel as well as exploring new markets (AirAsia, 2016a). According to Shaw (2012) human resources management is an imperative function in ensuring company activities are supported. According to Nagle & Holden (2012) managing operational costs is essential in ensuring that the performance of employees is compensated. Finally, technology has been a critical component of AirAsia’s operations and a variety of technologies have been adopted by the airline in order to make operations efficient and easier and also minimize the cost (Lamb, 2014; Porters, 2013). For instance, AirAsia particularly uses the YMS, CRS and ERP technologies whereby they are used for accounting for the operational costs and expected revenues, to aid direct sales through web-based inventory and reservation system, as well as helping to save time and speeding up data restoration and reporting process respectively (AirAsia, 2016c).
SWOT Analysis
SWOT analysis is without any doubts the most significant business strategy tool used for the analysis of the internal environment of the business or company (Besanko et al., 2014). The SWOT Analysis is majorly concerned with the identification of the business’s strengths, weaknesses, opportunities as well as threats both at organizational and operational/managerial level. As a result, the SWOT Analysis covers both the external and internal factors that are likely to influence its success (Mulcaster, 2013). Thus, in this section the strengths, weaknesses, opportunities as well as threats of AirAsia shall be discussed in details to ensure that the specific position of the company is determined (Kevint, 2013; Monroe, 2013).
Strengths
With regards to the strengths of the airline, AirAsia has ensured that it maintains low costs in its operations and maintenance mainly through the change of the aircrafts from Boeing 737 to A 320 particularly in Indonesia and Thailand. Besides, AirAsia India maintaining low operational cost as a result of the existing online reservation system, other strengths include no frills, quick checked in etc. considering the Indian aviation market there is a significantly untapped market which gives AirAsia an upper hand to penetrate and subsequently stimulating to potential markets. The other strengths of the airline company include adoption of a flat organizational structure in order to ensure aggressive, effective and focused management; efficient and/or multi skilled staff; strong brand recognition; leader in IT by being a frontrunner in implementing IT solutions within the aviation industry making the airline to be an ICT Award winning airline company; and also maintaining a single model of aircrafts is very critical in ensuring significant reductions in maintenance fees are achieved.
In addition, the AirAsia’s website attracts above 20 million viewers on a monthly basis due to its multilingual status meaning that the translation of its messages whether in the airline’s original website, Facebook account, or Twitter handle are powerful marketing tools (Monroe, 2013). Moreover, strategic alliance partnership as well as joint ventures with varied airline companies is the other strength of AirAsia mainly due to the fact that that it allows acquisition of more market share by the company subsequent to the attainment of more brand recognition (AirAsia, 2016c). The no frills strategy is difficult to achieve for long-haul flights despite the fact that the flight time for passengers is either less or more than two and a half hours (AirAsia, 2016a).
Weaknesses
The weaknesses of AirAsia are minimal; however, due to significantly huge investments in the acquisition or aircrafts as well as implementation of modern technologies mainly through outsourcing, there is a considerable increase in the airline’s operating costs. In addition, the AirAsia usually offer not more than 15 kilograms of luggage allowance making it less competitive compared to other airlines in the same market that offer a higher but luggage allowance (AirAsia, 2016c). Furthermore, the services of the company are not optimal hence they pose other several weaknesses including limitation of service resources by lower costs; lack of centrality in the secondary airports’ location; lack of repair or maintenance facility for the AirAsia’s fleet, new market entrants are envisaged to provide services that are sensitive to prices; government interference on passenger compensations and regulation on airport deals; and finally the large number of complaints raised by customers, especially among the passengers with disabilities since limited services are offered to this group of customers (Laermer & Simmons, 2013).
Opportunities
For the opportunities of AirAsia, the airline should capitalize on offering low fares which are critical in encouraging people drawn from diverse walks of life to travel through the air. In addition, by embracing A320 which is more efficient to operate is essential in the stimulation of superior numbers as well as services to the passengers (AirAsia, 2016a). As a result, of the airline’s adoption of technology there is a possible opportunity in introducing booking of the flights through SMS thereby allowing anytime and every time booking of the seats in the aircraft prior to security scrutiny which has been critical in making sure that AirAsia flights are successful.
Threats
Finally, the threats of AirAsia are numerous but if they are effectively managed the company has the potential to continue making profits. The specific threats associated with the operations of AirAsia India include: the full service airlines not only in India but the ASEAN region as a whole have began lowering their prices in their attempts towards competing with low-cost carriers (LLCs) meaning that the entrance of other low-cost carriers (LLCs) is a threat to AirAsia India. Moreover, high fuel prices as well as the government policy and aviation regulation tend to vary across countries and regions (Mintzberg, Ahlstrand & Lampel, 2014). Additionally, there are also other factors which pose threats to the operations of AirAsia Indian including legal constraints that specifically affects strategic alliance across various countries; negative influence of customer confidence due to probable terrorist attack, accident as well as natural disasters; and finally the increased cost of operational costs in the production of value added aviation services (AirAsia, 2016c).
Strategic Choices
According to Hill, Gareth & Jones (2012) strategy formulation which is concerned with strategy choices involves the process of the selection of the most appropriate combination of actions aimed at ensuring that the goals and objectives of the organization are achieved. The process of choosing the appropriate strategic choice for AirAsia India follows the Porter’s generic model which involves 6 steps which such as setting organization’s objectives, evaluation of the environment of the business and/or organization, setting quantitative targets, aiming with divisional plans, analysis of the performance and ultimately selecting the choice of strategy (Homburg, Kuester & Krohmer, 2014). However, the Porter’s generic model is customized for the AirAsia into three key strategies such as the cost leadership, differentiation and focus.
The strategic choices are informed by the increasing middle class, GDP as well as population in India according to World Bank and Euromonitor International forecasts. As a result, the available actions include more expansion into the Indian and Chinese aviation market as well as developing cargo services. Each of these strategic choices poses a variety of benefits as well as detriments customers (Laermer & Simmons, 2013).
Recommended Plan of Action
Considering the prevailing conditions the Indian aviation market more expansion in the Indian market is the most appropriate since it will help the company to gain competitive advantage with its competitors such as IndiGo, GoAir, SpiceJet in that region and gain more economic of scale. This will include increasing the company revenues by a 20 per cent, number of passenger by 30 per cent as well as fleet number and length by 10 per cent.
Conclusions
After looking at above analysis the recommended strategy for AirAsia in the Indian aviation market is the expansion of its low-cost long haul flights further in China and the far regions of India. However, the company should consider aggressive expansion to the country. This is attributable to the rising middle class and population in the two countries as well as tourist attraction and being the biggest contributor to the world GPD growth by 2017 offers huge opportunities for AirAsia.
Laermer, R., & Simmons, M. (2013). Punk Marketing. New York, NY: Harper Collins.
Lamb, R. B. (2014). Competitive strategic management. Englewood Cliffs, NJ: Prentice-Hall.
Mintzberg, H., Ahlstrand, B., & Lampel, J. (2014). Strategy Safari: A Guided Tour through the Wilds of Strategic Management. New York, NY: The Free Press.
Monroe, K. B. (2013). The Pricing Strategy Audit. Cambridge, MA: Cambridge Strategy Publications.
Mulcaster, W. R. (2013). Three Strategic Frameworks. Business Strategy Series, 10(1), 68 – 75.
Nagle, T., & Holden, R. (2012). The Strategy and Tactics of Pricing. New York, NY: Prentice Hall.
Reichheld, F. (2012). The Loyalty Effect. Boston, MA: Harvard Business School Press.
Saha, G. C. & Theingi, S. (2013). Service quality, satisfaction, and behavioral intentions: A study of low-cost airline carriers in Thailand. Managing Service Quality, 19(3), 350-372.
Schiffman, L., Bednall, D., O’Cass, A., Paladino, A., Ward, S. & Kanuk, L. (2008). Consumer Behavior, (4th ed.). NSW, Australia: Pearson Education Australia.
Shaw, E. (2012). Marketing strategy: From the origin of the concept to the development of a conceptual framework. Journal of Historical Research in Marketing, 4(1), 30–55.
We can write this or a similar paper for you! Simply fill the order form!
You are the owner of a small chain of hotels, and you are concerned about the United States Department of Labor’s (DOL) new rules under the overtime provisions of the Fair Labor Standards Act. In order to be eligible for one of the white-collar exemptions to the overtime rules, you must pay an employee a minimum weekly salary of $455 per week, or $23,660 per year, whereas the previous threshold was $250 per week. Employees making less than $455 per week generally cannot be exempt. This will cost you money either in overtime pay or higher salaries. Can you challenge this new DOL rule? How would you go about challenging it? (26 points) (A 1-page response is required.)
SAMPLE ANSWER
Business Law
Whereas the overtime rules present several opportunities for both employers and employers, it is important to note the problems presented by these rule. Thus, the new DOL rule can be challenged in line with the challenges it presents to small businesses.
Prior to the enactment of the DOL rule, there was no requirement for employers to pay overtime to particular kinds of managers and administrators who worked over 40 hours a week, as long as the employers classified these managers and administrators as salaried employees, and as long as they earned over $23,660 per year (Atkinson, 2015). The fact that the new rule requires employers to reclassify employees implies that many workers with administrative or managerial duties making over $23,661 per year will be greatly affected. Whereas larger businesses tend to have proper classifications of their workers, smaller companies, such as our small chain of hotels, which do not have Human Resource departments with experienced specialists, have higher chances of misclassifying workers. It is important to challenge this law because it will even end up being disastrous to a significant percentage of employees. Most of the reclassified employees will end up losing benefits, status, flexibility and advancement opportunities. As for employers, overtime rules will drive up their costs and ultimately limit opportunities for moving up into management. Businesses will be forced to reduce hiring, cut working hours, reduce benefits and increase prices for goods or services.
Since these rules were passed by the Administration, we can challenge them by presenting our opinions to the Republican-run Congress, which may seek to counter the rules through legislation. Even though the court has approved the rules, the prospects of amendments being made are high as long as Congress approves.
What is the difference between a marketing plan and a business plan?
A business plan covers the overall elements of business, including the strategic plan, financial plans, target markets, sales, products and services, and operations. The business plan also contains information on how all of these elements relate to each other.
A marketing plan, in contrast, focuses on the marketing and marketing strategy of certain products and services. Essentially, the marketing plan is tasked with identifying potential market areas while also addressing how to appropriately engage in marketing messages for those products or services to target populations.
Therefore, both marketing and business plans cement the foundations of how the organization of business will operate. They identify which populations are served and which products or services will most likely contribute to the viability of the business or organization. Specific to the health care administrator, the marketing and business plan should focus on effective health care delivery and capitalize on the unique health care services offered by individual health care organizations.
For this Discussion, review the concepts of a marketing, business, and strategic plan in the resources for this week. Reflect on how these plans contribute to business operations. Then consider the consequences a potential misalignment between these plans might hold for the business or organization.
ANSWER THE FOLLOWING QUESTION:
1. An explanation of the consequences of how a misalignment between marketing plans, business plans, and strategic plans might affect the success of health care organizations and why.
2. Offer an example of when an alignment between these plans has contributed to effectiveness or success of the health care organization. Be specific and provide examples.
USE THE FOLLOWING ARTICLE & CHAPTER 1 & 2 REFERENCES:
1.Gombeski, W. R., Jr.,, Taylor, J., Piccirilli, A., Cundiff, L., & Britt, J. (2007). Effectively executing a comprehensive marketing communication strategy. Health Marketing Quarterly, 24(3/4), 97–111.
2.Hillestad, S. G., & Berkowitz, E. N. (2012). Health care market strategy: From planning to action (4th ed.). Burlington, MA: Jones & Bartlett Learning.
o Chapter 1, “Strategy Development and the Strategic Mindset” (pp. 1–33)
o Chapter 2, “Understanding the Strategic, Business, and Marketing Planning Process” (pp. 36–56)
SAMPLE ANSWER
The alignment of the business, marketing, and strategic plans is essential for the smooth progress of operations in a given organization (Gombeski et al., 2007). These plans influence the organization structure of the given healthcare organizations. The misalignment and poor coordination of these plans lead to serious consequences on the operation of the healthcare organization. The misalignment lead to the reduced productivity in the heath care organization. The health care organization will face the consequence of decreasing potential growth. Such cases are caused by the poor connection between various plans. The scheduling of medication, financing of operations and also marketing of the service offered by the health organization will be at a decline affecting the success of the organization (Gombeski et al., 2007). The misalignment leads to poor planning that causes the healthcare organization to direct its efforts and services in the wrong directions. The following of the unrealistic objectives leads to the wastage of the opportunities such as expansion that contribute to the greater success of the healthcare organization. The misalignment also leads to the poor control of the operations of the organization. The ineffective control affects the ability to take corrective action of improvement after determining the performance of the organization (Hillestad & Berkowitz, 2012). The misalignment also causes the ineffective communication between the various departments in a healthcare organization that is an obstacle to the success of the various operations.
There are numerous benefits resulting from the proper alignment of the various plans in the health care organization. The Sutter healthcare organization is one of the successful healthcare organizations in the US that enjoy the fruits of the proper alignment of its plans (Ball et al, 2013). The health organization has beeADGn able to develop new healthcare services, commence the medical practice and also revamp the existing patient flow in the various offices of the organization. The development of the new facilities is done considering plan various phases. The plans considered by the organization include studying the market to understand demand, carrying operation plans for each proposed entity and also financial feasibility studies (Ball et al, 2013). Such activities have helped the organization control in its operations effectively and also set realistic objectives that are efficiently achieved. In this case, the alignment has proved to contribute to the success of the Sutter healthcare organization.
References
Ball, M., Weaver, C., & Kiel, J. (Eds.). (2013). Healthcare information management systems: Cases, strategies, and solutions. Springer Science & Business Media.
Gombeski, W. R., Jr.,, Taylor, J., Piccirilli, A., Cundiff, L., & Britt, J. (2007). Effectively executing a comprehensive marketing communication strategy. Health Marketing Quarterly, 24(3/4), 97–111.
Hillestad, S. G., & Berkowitz, E. N. (2012). Health care market strategy: From planning to action (4th ed.). Burlington, MA: Jones & Bartlett Learning.
We can write this or a similar paper for you! Simply fill the order form!
The structure of the UK economy has considerably changed for the past ten years, and this has been as a result of the emergence of the oil production and also due to industries that previously consisted of the mainstay of the UK economy (Stam & Coleman, 2010). The UK has worked to ensure that its economy encourages the free movement of goods, services and people, in general, implying that its economy is well maintained for the benefit of all. The country has the supply of natural resources that are taking place to guarantee a healthy economy (Al-Najjar, & Hussainey, 2011). Overwhelmingly subject to outside excitement for storing up, and on being the second most fundamental exporter of capital, the advantage of UK firms lies in the pricing open of remote markets. The fundamental bit of the City in the general private endeavour and the essential for progression recommends that future favourable circumstances are outstandingly subject to Goliath new markets like China. This paper gives an account of the changing structure of the UK economy despite the many setbacks that the economy faced in future.
Post-war shifts in economic power from manufacturing to services
The British economy in 1948 included things like manufacturing, oil and gas as well as utilities amounting to 41 percent of the economy, but operations changed due to the capitalist governance evident in the country (Lowe, 2011). The percentage reduced up to 14 percent in 2013, while on the side of the service sector the share increased from 46 percent to 79 percent affirming all the evident changes. The construction share of the economy has proven to be more stable than expected and has maintained 6% of the (GDP) (Brook, Matthews, & Darke, 2011). The agriculture sector in the country has reduced from 6 to 1 percent, proving to have a huge problem.
The UK economy makeup
The manufacturing sector has declined rapidly in the UK economy; proving to be of no use as required, even though all the G7 economies have also experienced a gradual decline in production and manufacturing sectors as well (Chowla, Quaglietti & Rachel, 2014). The G7 economies are inclusive of UK, US, Japan, Italy, Canada and France all working to better the economy of the whole world. The UK economy is not much attributed to the manufacturing sector as it is very low compared to the recent past. Germany is the country that is ranked the top regarding manufacturing products and is followed by Japan with a percent of 19 (Moran, 2010).
Growth of the UK financial sector
Between 2006 and 2009, the economy of the UK grew to account rapidly for 10 percent of the country’s GDP; hence being the highest among all the G7 economies. Canada had a GDP of 6.7% followed by Germany with a GDP of 3.9 percent. Due to the Euro crisis that took place, it was evident to prove that the British economy had fallen by 2.9 percent even though it was still stable in major economies. The latest ONS data has proved that the UK financial crisis is still below pre-crisis (13.6 percent), despite the measures put across to curb any other financial crisis in the future (Coates, 2014).
Financial services
In the UK, financial services are termed to be very necessary for they are a key part of the county’s export. The country is ranked the best on matters of exports to GDP among the other G7 economies due to its highest share of financial services. UK has the highest number of financial services followed by the US, which has only 15 percent of the financial services in the country (Fankhauser, 2013).
Improvements of the UK export downturns
In the UK, more improvements have been evident in the export and most of the subsequent recoveries have been made accordingly. The economy of the country recovered leading to improved growth in all its exports during the downturn (Engelmann, 2014). The value of pound fell between 2007 and 2009, and this factor contributed to making the country’s goods cheaper abroad. On the other hand, the mechanization and the without a moment to additional time systems utilized by bosses to restore points of interest or take a perfect position on contenders are in like the way a wellspring of insufficiency. A strike in one piece of the creation chain can go all in all operations to a beating stop in a matter of hours. The openness of the UK economy all around and its part in reusing general record clears up why New Labour and the decision class have heaved themselves so eagerly behind and championed deregulation and liberalization.
Less spending on investments
In the UK, less is spent on the country’s investment matters as compared to the other G7 economies where spending is very high. In 2013, the UK spent only 15 percent of the GDP investments while a country like Germany spent 17 percent (Kokot, 2014). On the other side, France had the highest rate of spending in its investment matters totalling up to 25 percent. UK is a country that is very keen on matters of investments and gains a lot from then investments in the country (Ekins, Summerton, Thoung & Lee, 2011). The fixed investments that are practiced there bring success in return to the economic growth. The country is very keen not to spend much on investment matters due to the Euro crisis that once befell its financial sector in 2008 and 2009.
The UK household spending
In 2008, the household spending in the UK fell by 5.7 percent, leading to huge financial losses in the country. The UK suffered a huge loss as it was more dependent on consumer spending and once consumers did not have enough finances to spend, the country suffered a huge loss (Ekins, Anandarajah, & Strachan, 2011). The recovery of the UK economy was mainly centered on the household consumptions that are why it took some time to pick up.
Conclusion
Despite the diminishment in gathering the whole world pounding photo of its breakdown is a long way from veritable. The UK still holds a fundamental gathering center and its offer of general tools is corresponding to that of China. The case that there is another division of work whereby all low-talented employments are being passed on is fundamentally misrepresented. Such claims are likely particular and overestimate the potential for moving time (or parts of creation) out of the nation. The widely referred to pieces of gadgets and materials have continually been footloose. Regardless, other fundamental spaces of creation, for example, nourishment retailing, transport and welfare associations are unwaveringly settled in the home economy. Inside of an ocean of poor benefit, there are islands of sufficiency in two or three domains, with amazingly profitable general firms in the auto period, guardian, pharmaceuticals and bolster retailing. What is valid is that the UK is storing up utilizations far fewer experts.
References
Al-Najjar, B., & Hussainey, K. 2011. Revisiting the capital-structure puzzle: UK evidence. The Journal of Risk Finance, 12(4), 329-338
Brook, K., Matthews, D., & Darke, J. 2011. Changes to the picture of the UK economy – impact of the new SIC 2007 industry classification. Economic & Labour Market Review, 5(3), 41-61
Chowla, S., Quaglietti, L., & Rachel, L. 2014. How have world shocks affected the UK economy? Bank of England.Quarterly Bulletin, 54(2), 167-179
Coates, D. 2014. The UK: Less a liberal market economy, more a post-imperial one. Capital & Class, 38(1), 171-182
Ekins, P., Anandarajah, G., & Strachan, N. 2011. Towards a low-carbon economy: Scenarios and policies for the UK. Climate Policy, 11(2), 865-882
Ekins, P., Summerton, P., Thoung, C., & Lee, D. 2011. A major environmental tax reform for the UK: Results for the economy, employment and the environment. Environmental and Resource Economics, 50(3), 447-474
Engelmann, S. 2014. International trade, technological change and wage inequality in the UK economy. Empirica, 41(2), 223-246
Fankhauser, S. 2013. A practitioner’s guide to a low-carbon economy: Lessons from the UK. Climate Policy, 13(3), 345-362
Kokot, P. 2014. Structures and relationships: Women partners’ careers in germany and the UK. Accounting, Auditing & Accountability Journal, 27(1), 48-72
Lowe, J. 2011. Concentration in the UK construction sector. Journal of Financial Management of Property and Construction, 16(3), 232-248
Moran, M. 2010. The political economy of regulation: Does it have any lessons for accounting research? Accounting and Business Research, 40(3), 215-225
Stam, P., & Coleman, J. 2010. The relationship between hours worked in the UK and the economy. Economic & Labour Market Review, 4(9), 50-54
We can write this or a similar paper for you! Simply fill the order form!
We completed presentation before the essay, so the essay is required to remain the same topic with our presentation, the topic of this business plan is Cake Shop.
Yummy cake shop is cake shop established on 1st Dec 2014. It is located at Lonsdale Street, Melbourne on a street front shop. Registered as a partnership business the business ABN No is 52004005734. The cake shop expects to win regular customers with its broad variety dry cakes and yummy bakers customer favourites. The cake shop is owned by two high school friends John Sut and Saleem Hassan.
The market:
Target Market
Yummy Cake Shop targets on the middle and upper-income brackets consumers. People within these market segments are the main consumers of the majority of the cake industry.
The specific Target Market includes:
The parties Group: These are individuals who want to purchase a cake for celebrations and other forms of parties. These types of consumers pre-order the cakes and will be targeted through extensive advertising and word of mouth.
Individual buyers: To win individual buyers, the business will focus on using window display marketing strategy to attract passersby.
Regular residents: These are individual customers who purchase cakes regularly for consumption. Yummy Cake Shop would want to establish a large regular customer base. This will ensure that the organization will have consistent profits hence business sustainability.
Marketing Strategy
Yummy Cake shop targets the returning customers that reside in the neighbourhood. The organization will focus on offering a personal customer service to make customers satisfied and hence customer loyalty. Yummy Cake shop will also focus on offering high-quality products in a competitive market.
The Future
Vision Statement:
Our vision is to be the best Cake shop offering high-quality cakes at an affordable price. To achieve this vision we intend to bake quality cakes maintain a friendly customer relationship
Objectives:
To increase the second year sales by 40% and the subsequent year sales by 25%, and
To expand to two storefronts by the fourth year of business.
Financial Considerations
The start-up capital was contributed by the two partners that amounted to $110,000. The company has applied for a loan of $100,000 to boost their business activities. The loan will be payable in a period of 10 years.
Sales projections
Year
Sales
Gross Margin
Net Profit
2015
491,000
478,000
13,000
2016
567,000
531,000
36,000
2017
655,000
609,000
46,000
Introduction
Business Details
Products and Services: Yummy Cake Shop offers a wide variety of dry cakes and flavored cupcakes such as Gingerbread Flavour, Rose petal, gingerbread flavour and raspberry fudge. On the same note, the cake shop offers old time favourites such as vanilla, strawberry and red Velvet.
Registration details
Business Name: Yummy Cake Shop
Trading Name: Yummy Cake Shop
Date Registered: 1st Dec 2014
Location Registered: Melbourne, Australia
ABN: 52004005734
GST: 10%, Registered 1st Dec 2014
Business Structure: Partnership this structure is selected because of less start-up cost, few legal requirements and ability to utilize.
Business Premises
Business Location: Yummy Cake Shop is located at Lonsdale Street, Melbourne on a street front shop. The shop is divided into two rooms. The front shop serves as an outlet for the Yummy Cakes as well as the cashier’s office. The back room serves as the bakery where the chefs prepare the cakes that will are sold at the shop. Lonsdale Street is a busy street because of the surrounding shops and a supermarket. Therefore, these visitors will be attracted to our shop for a quick bite.
The business premises are leased for one year. The contract is renewed each year upon payment of rent.
Legal Considerations: Licences required include Trade licences and Health and safety licences
Management and Ownership
Names of Owners: John Sut and Saleem Hassan. The owners are also the ones running the business. John Sut is the manager and chief executive officer (CEO) of the business because of his previous experience. On the other hand, Saleem Hassan is the chief financial officer (CFO) as well as the cashier.
John Sut is quick in decision making and has a keen eye for quality of production. Therefore, his profile and skills fit the position of a manager.
Skills, Experience, and Qualifications:
John: Management
Has a bachelor’s degree in human resource management and used to work at KFC as human resource manager.
Saleem: He is a certified public accountant. He just completed his undergraduate degree in Finance.
Business Operations
Organisation chart
Key personnel
Required Staff
Job Title
Name
Expected staff turnover
Skills or strengths
Manager
John Sut
Has a bachelor’s degree in human resource management and used to work at KFC as human resource manager.
Cashier
Saleem Hassan
He is a certified public accountant. He just completed his undergraduate degree in Finance.
Baker
Evans Brown
Worked as a baker in Kings Bakery
Baker
Fran Reid
Worked at queens garden as a baker and event organizer
Cleaner
Jo Stevens
Underwent basic cleaning and laundry training
Current Staff
Job Title
Quantity
Expected staff turnover
Skills necessary
Date required
Quality control
[1]
[2-3 years]
Must have two years experience working in catering related fields.
01/01/2016
Recruitment options
Because of the small size of the business, the management will recruit employees through communication with friends and family to find the most appropriate quality manager. This strategy will help the organization to reduce recruitment cost and easily find a good employee.
Training Programs
The existing employees in the organization will be the ones responsible for orientation and training of new employees. A new employee will be assigned a worker to train and supervise him for two weeks before he/she begins working independently.
Skill Retention Strategies
Skill retention is an important part of human resource management. The organization will retain the best workers through motivation and salary increase. By rewarding exceptional performance employees will prefer to work with Yummy Cake Shop rather than to work elsewhere.
Service Process
Yummy Cake Shop will process three types of orders. That is take away orders, dined in orders and special orders.
Take away orders: refers customers request to purchase cakes and take them home. The orders are processed by the sales person on the counter. The cakes will be packed in a special takeaway packaged and given to the customer to take home.
Dined in orders will be offered for the clients to consume within the business premises with a soft drink such soda.
Special orders: refer to those orders for cakes used for special occasions such as weddings, birthdays among others. These orders will require the client to pre-order for the chefs to prepare the orders before it is processed by the sales person.
Suppliers
Yummy Cake Shop will purchase its wheat flour required for baking directly from the millers to reduce the cost of purchasing them. Other baking materials such as cooking oil, salt, and baking powder will be bought from a wholesaler so as to utilize the discount allowed by buying in bulk.
Assets Required
Equipment
Purchase date
Purchase price
Running cost
Ovens
1st Dec 2014
$155
0
Proof Boxes
1st Dec 2014
$102
0
Baking Sheets
4th Dec 2014
$20
0
Work Tables
4th Dec 2014
$92
0
Planetary dough mixer
16th Jan 2015
$26
0
Inventory
Inventory item
Unit price
Quantity in stock
Total cost
Flour
25
50
1,250
Sugar (Granulated, powdered and brown sugar)
10
20
200
Baking Soda
2
20
40
Baking Powder
3
8
24
Butter milk
2
4 Litres
8
Food Colouring
1
20
20
Flavours
2
6
12
Eggs
2
250
500
Milk
2
50
100
Lemon juice
1
2
3
Salt
0.5
1
0.5
Vegetable oil
2
4
8
water
0.5
200
100
Technology Software:
Yummy Cake Shop uses accounting packages to keep daily records and business transaction records. The business is also planning to open up a website that will be used to advertise the company products and establish an online presence (Razak et al., 2014).
Trading Hours: Our business shop will be open from 8 am to 5:30 pm on weekdays. However on Saturday and Sunday, the shop will operate from 8 am to 11 am.
Communication Channels: the main communication channel will be through telephone calls. The business organization encourages clients to communicate by making a call or writing a message using our office mobile number. However, we also process email orders. On the same note, once a website is a build, we will also process orders via purchase portal in the website.
Payments Accepted: Yummy Cake Shop accepts payment in the form of cash, we also accept credit and debit cards for payments above $25.
Credit Policy: We accept credit for regular customers but the credit must not exceed $200. Invoices will be sent by mail every once a month to request for creditors to pay their dues (Ossolinski et al., 2014).
Warranties & Refunds: we accept back broken cakes if they were transferred using our means. We also offer refunds for merchandise that get spoiled during transportation. However, the customer must produce a valid receipt that was originally used to purchase the product.
Quality Control: The Company is planning to employ a quality control manager that will ensure that the cakes offered for sale are of good quality. The new manager will regularly do quality control checks to ensure that all the company’s products are of high quality.
Licences and permits;
Insurance:
Public Liability: The business has no public liability insurance to cover for any third party from death or injury. Similarly, employees are expected to make arrangements with insurance companies to insure themselves
Business Assets: Business assets are insured against fire, burglary and theft. Some of the assets insured include production facilities, business computers, and the premise television set.
Action Plan
Sustainability milestone
Target
Target date
Reduce the use of burners that use unclean energy
40% Reduction
Jan/2017
The Market
Products/services
Product/Service
Description
Price
Cup Cake
3.50
Rainbow Cake
2.95
Gingerbread Flavour
3
Banana Rum
2.50
Rose Petal
3.45
Raspberry Fudge
3
Red Velvet
3.50
Vanilla
3.50
Straw berry
3.50
Market Positioning
The location is imperative when it comes to marketing and promotion. Yummy Cake Shop is located in a high-traffic retail area in Lonsdale, Melbourne Australia. The cake shop is located close to other shops such as electronic shops among others. These shops attract high population, and Yummy will be able to pitch some of these regulars. We will focus on providing unique types of cakes as well as superior pastry shops (Harrington et al., 2013). Similarly, the company will advertise using fliers, magazines and promotions to attract more customers.
Pricing Strategy
Price is an important factor when competing with other key players in the industry and sellers of competing products such as Ice creams and coffee shops (Lappo et al., 2013). Our cake shop will offer slightly lower prices as compared to other bakeries and pastries. The company will also offer a 7% discount for a person who purchases more than three cakes in a single day.
Break-even analysis
The breakeven analysis is calculated with assumptions on running costs such as utilities, transport cost among others.
Target Market
Market Segmentation
Our market is divided into four segments. That is
The parties Group: These are individuals who want to purchase a cake for celebrations and other forms of parties. These types of consumers pre-order the cakes and will be targeted through extensive advertising and word of mouth.
The individual buyers: To win individual buyers, the business will focus on using window display marketing strategy to attract passersby.
Regular residents: These are individual customers who purchase cakes regularly for consumption. Yummy Cake Shop would want to establish a large regular customer base. This will ensure that the organization will have consistent profits hence business sustainability.
Market Research
Market Analysis
Potential Customers
Growth
2016
2017
2018
The parties group
25%
10,000
10500
11,050
Individual Buyers
15%
5000
5,750
6,613
Regular Local Residents
15%
5000
5,750
6,613
Environmental and Industry Analysis
The banking business in Australia has been there for a very long time. Therefore, there are other well-established business organizations in cake shop niche. Some of the key competitors include;
Donut and Coffee Shops,
Restaurants,
Ice cream shops,
Free-standing traditional bakeries and,
Supermarkets.
Customer Demographics
Cakes are universal and, therefore, every body’s favorite. Thus, Yummy Cake Shop will have customers ranging from children, teenager, adults and the elderly (Solomon et al, 2012). The cakes will also be demanded for celebration purposes such as weddings, graduation parties, and birthdays among others.
Key Customers
From the customer demographics discussion, the key customers include regular buyers from within the neighbourhood and buyers for celebration purposes such as weddings, birthdays, graduation ceremonies among others.
Value to Customer:
Our customers will derive value from consumption of our variety of cakes with different flavours. These cakes will satisfy basic human needs of hunger as well as self-actualization needs such as the feeling of achievements during graduation parties.
Customer Management:
The customer is a very valuable asset for any organization. Yummy Cake shop will treat customers in a friendly manner following stringent business ethics.
S.W.O.T Analysis
Strengths
Weaknesses
– Low cost of production due to flat organization structure.
– Lower price than competitors
– Strong positioning of the Shop
– High quality varieties of cakes
– New to the market, not established
– Limited cash flow
– Low customer Base
– High advertisement cost
Opportunities
Threats
– New Technology
– New creation of new products
–
– New competitors enter the market
– High expenditure cost
– Stiff competition
Competitors
Competitor
Established date
Size
Market share (%)
Value to customers
Strengths
Weaknesses
Le Petit Gateu
30
Unique creations and irresistible classics such as chocolate gateu
-Located at inner-city
-Good market positioning
-Small physical space for eating out
Brunetti cakes
20
Variety of celebratory cakes such as vanilla sponge, chocolate chips and Braziliana
-Italian cakes that are entirely sweet
-strong market presence
-Strong customer loyalty
-management problems.
Hausfrau
Good desserts, birthday cakes
They do classic European cakes which are unique in the Australian market
-Strong market presence
Large operations hence diseconomies of scale
Advertising and Sales
Advertising and promotional Strategy
Planned promotion /advertising type
Expected business improvement
Cost ($)
Target date
News paper and magazines
Increased customers
20
February/2016
Mouth to mouth
Increased demand because of creation of good image
Free
April/2016
Social media campaigns
Increased customer loyalty & better image for the company
Free
July/2016
Sales Distribution Channels
Due to the small nature of the business, the products will be distributed through the storefront shop. Clients will be expected to make their orders physically and collect their cakes. On the same note, clients can make orders through email and will be delivered by sales agent if the customer is within Melbourne (Arnold, 2014).
Financial Projections
Financial Management goals
To cut down the cost of production.
Reduce purchasing expenses through bulk buying
Strategic partnership to obtain more funds for expansion
BREAK-EVEN ANALYSIS
Break-even Analysis
Monthly Units Break-even
17,300
Monthly Break-even
$38,634
Assumptions:
Average per-unit revenue
$2.22
Average Per-unit
$0.35
Estimated Monthly fixed cost
$32,343
Finance Required
YUMMY CAKE SHOP START UP REQUIREMENTS
START-UP REQUIREMENTS
Start-up Expenses:
$3000
Legal
$20000
Premise Renovation
$4000
Expensed Equipment
$4000
Other
$1,000
TOTAL START-UP EXPENSES
$32,000
Start-up Assets
Cash Required
$70,000
Other Current Assets
$12,000
Long-term Assets
$65,000
TOTAL ASSETS
$147,000
Total Requirements
$211,000
STARTUP FUNDING
358,000
Start-up Expenses to Fund
$64,000
Start-up assets to Fund
$147,000
TOTAL FUNDING REQUIRED
$211,000
Assets
Non-cash Assets from Start-up
$77,000
Cash Requirements from Start-up
$70,000
TOTAL ASSETS
147,000
Liabilities and Capital
147,000
Liabilities
46,000
Current Borrowing
0
Long-term liabilities
$100,000
Accounts Payables
$1,000
Other Current Liabilities
TOTAL LIABILITIES
46,000
TOTAL CAPITAL
$147,000
TOTAL CAPITAL AND LIABILITIES
$147,000
Total Funding
$211,000
Sales Budget
Sales Forecast
Unit Sales
Month 1
Month
2
Month
3
Month
4
Month
5
Month
6
Month
7
Month
8
Cake Sales
4,950
7,500
9,500
13,500
13,500
13,500
13,500
13,500
Beverage Sales
2,050
2,500
3,000
4,500
4,500
4,500
4,500
4,500
Other
0
0
0
0
0
0
0
0
TOTAL
UNIT
SALES
7,000
10,000
15,500
18,000
18,000
18,000
18,000
18,000
Cakes
$3.50
$3.50
$3.50
$3.50
$3.50
$3.50
$3.50
$3.50
Beverages
$1
$1
$1
$1
$1
$1
$1
$1
Other
0
0
0
0
0
0
0
0
Sales
Cakes ($)
17,325
26,250
33,250
47,250
47,250
47,250
47,250
47,250
Beverages ($)
2,050
2,500
3,000
4,500
4,500
4,500
4,500
4,500
TOTAL SALES ($)
19,375
28,750
36,250
51,750
51,750
51,750
51,750
51,750
Purchases Budget
Unit Costs
Month
1
Month
2
Month
3
Month
4
Month
5
Month
6
Month
7
Month
8
Direct Unit Cost
Purchases of Cake Raw Materials ($)
$0.50
$0.50
$0.50
$0.50
$0.50
$0.50
$0.50
$0.50
Beverage Purchases
$0.25
$0.25
$0.25
$0.25
$0.25
$0.25
$0.25
$0.25
Purchase
Expenses
Purchases of cake Raw Materials
$2,475
$3,750
$4,750
$6,750
$6,750
$6,750
$6,750
$6,750
Purchase of beverages
$512.5
$625
$750
$1,125
$1,125
$1,125
$1,125
$1,125
TOTAL PURCHASES OF RAW MATERIALS
$2,987.5
$4,375
$5,500
$7,875
$7,875
$7,875
$7,875
$7,875
Operating Expenses Budget
OPERATING EXPENSES
Month
1
Month
2
Month
3
Month
4
Month
5
Month
6
Month
7
Month
8
Payroll
$0.3
$0.46
$0.58
$0.83
$0.83
$0.83
$0.83
$0.83
Taxes
$0.21
$0.14
$0.11
$0.08
$0.08
$0.08
$0.08
$0.08
Marketing
$0.11
$0.07
&0.06
$0.04
$0.04
$0.04
$0.04
$0.04
Utilities
$0.10
$0.06
$0.05
$0.03
$0.03
$0.03
$0.03
$0.03
TOTAL OPERATING EXPENSES
$0.72
$0.73
$0.8
$0.23
$0.23
$0.23
$0.23
$0.23
Budgeted Income Statement for Year 1
Yummy Cake Shop
Revenue
$
$
We can write this or a similar paper for you! Simply fill the order form!