Question/Prompt: The assignment this module/week is to research an international group, NGO, or other similarly situated group and explain how this group is helping to engage an international audience. If this is an area of interest or passion for you that should also be noted.
SAMPLE ANSWER
United Nations Children’s Fund (UNICEF) is a leading advocate for children and women’s rights formed in the year 1946 in response and destruction brought by World War II. It began its operations in few countries and is currently active in 157 countries across all the continents (Murray & Newby, 2012). The organization is committed in achieving results in five areas: protection against violence, discrimination, abuse and violence, stopping the spread of HIV/AIDS and improving ways of protecting the already infected persons. Moreover, UNICEF ensures that education and immunization rights are given to all children irrespective of their location. Like most organizations, UNICEF has a mission which is to remain focused on the five priorities even in the midst of chaos. The world health organization (WHO) has been working closely with UNICEF on a strategy to fight vaccine preventable diseases which kill a high number of people yearly, with most of them being children. While taking into account ethics that involve culture and religious beliefs of people who don’t acknowledge immunization, UNICEF and WHO assists governments in financing, designing, and implementing national immunization programs to minimize health related complications. The excellence of the UNICEF internal management and operations together with information, advocacy and communication helps to enhance the success of their goals. Through planning, reporting, monitoring and evaluation, UNICEF management has been able to change the world by the use of its five goals for the better interest of the child to enjoy an ordinary childhood and a future filled with hope (Murray & Newby, 2014). Statistics have shown that UNICEF has provided practical solutions, which are extraordinarily effective by having held tireless crusades against diseases, suffering and advocating for quality health status in children. A generation ago, 70,000 children died each day and this number has been able to reduce by half since UNICEF has been able to provide sanitation, good water, nutrition and good health for children to help them survive. Today, has managed to reduce the infant mortality rate, which used to be a serious problem several decades ago (Jolly, 2014). Therefore, children are able to thrive from early childhood through adolescence since they are protected from violence, exploitation, and other deadly diseases.
References
Jolly, R. (2014). UNICEF (United Nations Children’s Fund): Global Governance That Works (Global Institutions). Routledge, 1st edition
Murray, C & Newby, H. (2012). Data Resource Profile: United Nations Children’s Fund (UNICEF). International Journal of Epidemiology. Vol. 41 Issue 6, p1595-1601
We can write this or a similar paper for you! Simply fill the order form!
Instructions this is an ongoing assignment with different parts. The first assignment that I had Custom Phd thesis completed chose the company: Brookside Dairy Company.
now this assignment(below) will be researched / answer based on the same selected company that I choose to do my SSP on which again is Brookside Dairy Company!.
Please see below Assignment 1 completed by custom Phd thesis weeks ago.
Brookside Dairy Company is an organization that is concerned with the processing of raw milk into various end products that include pasteurized milk, yoghurt, fermented milk, butter and cheese among others. This company operates in the Kenyan dairy industry and happens to be one of the well-established milk companies in that country. The Kenyan dairy industry comprises small and large organizations. Some of these companies include KCC (Kenya Corporative Cremearis), Tuzo and Fresha among others (Kavoi et al., 2013). Most of Brookside’s suppliers come from the rural areas from which they delivere milk to collection stations. This milk is then collected by the company’s trucks and taken to the firm for processing. Milk processing involves several stages that well-coordinated to yield the final product. These stages form the value chain.
Value chain is a series of activities or processes that an organization operating in a given industry executes to deliver or provide valuable services and products. This concept is founded on the process view of firms and takes into consideration the aspect of viewing a service or manufacturing organization as a system, which made of subsystems with transformation processes, inputs and outputs, and involve the consumption and acquisition of resources such as materials, labor, money, management, building, and administration (Agrawal et al., 2014). Value chain has significant effect on the business strategy as it affects the operations and logistics involved in the success of a business. As such, the business strategy of the firm should be developed in a manner that matches its value chain.
Technology impacts significantly on the value chain of a company. High technological research and development process activities contribute positively to the value chain of a company. Some of the aspects of technology such as automation of processes and other monitoring activities offer a great support to the value chain, which lead to enhanced efficiency and effectiveness of a company’s operations (Schloetzer, 2012). On the other hand, low technology affects the efficiency of firm’s value chain in a negative way.
Analysis of the company’s value chain takes into consideration the various processes that are involved in milk processing. This goal can be accomplished by focusing on the activities involved in conversion of milk into finished products (Agrawal et al, 2014). In relation to this, the company’s weakness exists in the inbound logistics involving warehousing of the raw milk that has been received from the suppliers. This problem results from inadequate cooling centers to cater for excess milk from suppliers. Moreover, the company’s cooling centers are located far from the factory due to lack of space near the organization. Thus, what are the ways through which the company can address the problem of handling extra milk from suppliers and far location of cooling centers? However, the company has strength in terms of outbound logistics and operations. The company has a well-coordinated system of converting milk into a high quality end product or products. In addition, the company’s outbound logistics takes into consideration a proper distribution channel that entails wholesalers and retailers.
Milk processing involves a series of interconnected stages. Once milk is received at the factory, it is analyzed for freshness using various tests and then transferred to cooling tanks. From the cooling tanks, the milk is taken for pasteurization and then analyzed for quality prior to packaging (Kakoi et al, 2013). The milk from the cooling tanks can also be processed into various products that are analyzed prior to their packaging. These processes are conducted through a well-coordinated task force that operates in various departments within Brookside.
The company’s value chain has a strategic significance to the larger value chain as it ensures a constant supply of milk and milk product into the market. Taking into consideration the fact that the firm has an advantage in terms of outbound logistics, the organization has various warehouses and centers where processed milk and milk products are taken prior to their distribution (Kavoi et al, 2013). From these centers, the products are taken to wholesalers who sell them to retailers, who in turn sell them to the final consumers. Moreover, the company has retailers who purchase products directly from the firm then sell them to final consumers.
References
Agrawal et al. (2014). Managing Value in Supply Chains: Case Studies on the Sourcing Hub Concept. California Management Review, 2(56) 23-54
Kavoi et al. (2013). Influence of Institutional and Socio-Economic Factors on the Supply Response of Smallholder Farms in the Marginal Zones of Kenya. Journal of International Development, 25(3) 393-411
Schloetzer, D. (2012). Process Integration and Information Sharing in Supply Chains. Accounting Review, 3(87) 1005-1032.
Assignment #2
Evaluating Systems Thinking
Think of the last time you visited a zoo. You visit the zoo to enjoy the wealth of variety of animals in their natural habitat. Next time you visit a zoo, notice that similar types of animals are presented together whereas ones that may be natural enemies are separated. In order for the entire zoo experience to work systematically and to be sustainable, the zoo leaders need to ensure all animals are available for the visitors to view, enjoy, and learn. The zoo leaders need to come together to share expertise of their individual areas to develop a holistic view of their system that takes into account all the relationships among the animals at the zoo. All parts of the zoo working together collaboratively, with effective communication and change management, allows for a total zoo experience that meets the organizational mission and vision. The zoo has successfully implemented systems thinking. Systems thinking can potentially create an organization in which all internal and external stakeholders, regardless of job or position, work together collaboratively. These stakeholders collectively use decision making and strategic planning to meet the needs of the customers while maintaining the objectives of the organizational mission and vision.
To prepare, consider the organization that you chose for your SSP as a system.(Brookside Dairy Company )
By Day 4 of Week 4, post a 3–5 paragraph evaluation of the potential impact of systems thinking on the organization.(Brookside Dairy Company ) Briefly describe the organization as a system.(Brookside Dairy Company ) Evaluate the potential impact of systems thinking by identifying potential benefits and potential drawbacks of applying systems thinking to the organization.(Brookside Dairy Company ) Justify your response.
Extend the conversation by identifying implications for practice or research, as well as for your own research agenda, where appropriate. Be sure to integrate one or two new related, and engaging, questions that will extend the discussion about your post in constructive ways. Try to think of a question(s) that will engage your peers in critical analysis and thinking about your organization, which may provide insight for your use as you continue preparing your sections of the major Weeks 4 and 7 Sustainable Solutions Paper (SSP)(Brookside Dairy Company ) due in this course.
Your response should include proper APA citations and adhere to all guidelines of APA style.
* please don’t copy from assignment 1 that has been completed. This is only to give you a brief history of the company. Also please note once again,this is an ongoing assignment and the following questions needs to be answer on the company I chose which is Brookside Dairy Company .
SAMPLE ANSWER
Brookside Dairy Company
Brookside Dairy Company Limited has since the beginning been the leading East Africa dairy company. Its operations are fully fledged in Kenya, Tanzania, and Uganda. It has the largest network of farmers, collection of milk, and the capacity for milk storage in east Africa. It is known to be the leading producer for milk and dairy products. Currently, it produces fresh milk, yoghurt, long life milk, butter, and ghee (Valentino, 2012).
Potential Impact of System Thinking
The potential benefits of applying systems thinking to this organization is that it helps one to see how things work and thus enables one to identify anything that is of value or of waste in the service or product delivery resulting to a better service and reduced costs. On the other hand, the potential drawbacks of applying systems thinking to this organization are that, it may be applied where the original problem statement was quite useful and thus affecting the organizations functions (Ing, 2013).
Others may use it as a flavor but instead, they end up replacing the best flavor. This are the times when system thinking is not really mandatory to the organization because it may end up affecting its structure for no good reason. It is only advisable in cases where the organization is not really functioning as required so it may be applied to solve its problem. Once we know the importance of the systems and the system thinking, it is good to ask ourselves questions like: “Which specific part of the system do I need to first attend to?” or “How relevant is this system to the dairy production?” This will probably help in the systems thinking decision-making.
References
Ing, D. (2013). Rethinking Systems Thinking: Learning and Coevolving with the World. Systems Research & Behavioral Science, 30(5), 527-547.
Valentinov, V. (2012). System-Environment Relations in the Theories of Open and Autopoietic Systems: Implications for Critical Systems Thinking. Systemic Practice & Action Research, 25(6), 537-542.
We can write this or a similar paper for you! Simply fill the order form!
Legal Aspects in Nursing Order Instructions: This paper is part of some other papers that you guys have already written for me such as 111549. Hear the writer will be working on building a case and so he will have to discuss some legal steps to hear.
Legal Aspects in Nursing
The writer should first in one paragraph elaborate on the legal components of this case below which is “informed consent and risk versus benefit” and then he will go ahead and use the point listed below as subheadings and them respond to them in detail citing court cases and using peer review articles to supports the facts.
In one paragraph discuss the legal components of this case below which is “informed consent and risk versus benefit”. Also Base on the Case Study 1: Malpractice Action brought by Yolanda Pinnelas, construct a 2 page paper about the legal constructs involved in the cases. Support the paper with peer-reviewed articles and case law where applicable. You may have an appendix that has samples of documents that support your positions or expands on the facts of the case. The paper should discuss the following issues. Discuss the following 3 points using each point as a subheading for the paper.
– Standards of care
– Duty, breach, damages and proximate cause
– Preparation for the court of the parties
Case Study 1: Malpractice Action Brought by Yolanda Pinnelas People Involved in Case: Yolanda Pinnelas-patient Betty DePalma, RN, MS-nursing supervisor Elizabeth Adelman, RN, recovery room nurse William Brady, M.D., plastic surgeon Mary Jones, RN-IV insertion Carol Price, LPN Jeffery Chambers, RN-staff nurse Patricia Peters, PharmD-pharmacy Diana Smith, RN Susan Post, JD-Risk Manager Amy Green-Quality Assurance Michael Parks, RN, MS, CNS-Education coordinator SAFE-INFUSE-pump Brand X infusion pump Caring Memorial Hospital
Facts: The patient, Yolanda Pinellas is a 21-year-old female admitted to Caring Memorial Hospital for chemotherapy. Caring Memorial is a hospital in Upstate New York. Yolanda was a student at Ithaca College and studying to be a music conductor. Yolanda was diagnosed with anal cancer and was to receive Mitomycin for her chemotherapy. Mary Jones, RN inserted the IV on the day shift around 1300, and the patient, Yolanda, was to have Mitomycin administered through the IV. An infusion machine was used for the delivery. The Mitomycin was hung by Jeffrey Chambers, RN and he was assigned to Yolanda. The unit had several very sick patients and was short staffed. Jeffery had worked a double shift the day before and had to double back to cover the evening shift. He was able to go home between shift and had about 6 hours of sleep before returning. The pharmacy was late in delivering the drug so it was not hung until the evening shift. Patricia Peters, PharmD brought the chemotherapy to the unit. On the evening shift, Carol Price, LPN heard the infusion pump beep several times. She had ignored it as she thought someone else was caring for the patient. Diana Smith, RN was also working the shift and had heard the pump beep several times. She mentioned it to Jeffery. She did not go into the room until about forty-five minutes later. The patient testified that a nurse came in and pressed some buttons and the pump stopped beeping. She was groggy and not sure who the nurse was or what was done. Diana Smith responded to the patient’s call bell and found the IV had dislodged for the patient’s vein. There was no evidence that the Mitomycin had gone into the patient’s tissue. Diana immediately stopped the IV, notified the physician, and provided care to the hand. The documentation in the medical record indicates that there was an infiltration to the IV. The hospital was testing a new IV Infusion pump called SAFE-INFUSE. The supervisory nurse was Betty DePalma, RN. Betty took the pump off the unit. No one made note of the pump’s serial number as there were 6 in the hospital being used. There was also another brand of pumps being used in the hospital. It was called Brand X infusion pump. Betty did not note the name of the pump or serial number. The pump was not isolated or sent to maintenance and eventually the hospital decided not to use SAFE-INFUSE so the loaners were sent back to the company. Betty and Dr. William Brady are the only ones that carry malpractice insurance. The hospital also has malpractice insurance. Two weeks after the event, the patient developed necrosis of the hand and required multiple surgical procedures, skin grafting, and reconstruction. She had permanent loss of function and deformity in her third, fourth, and fifth fingers. The Claimant is alleging that, because of this, she is no longer able to perform as a conductor, for which she was studying. During the procedure for the skin grafting, the plastic surgeon, Dr. William Brady, used a dermatome that resulted in uneven harvesting of tissue and further scarring in the patient’s thigh area where the skin was harvested. The Risk Manger is Susan Post, J.D. who works in collaboration with the Quality Assurance director Amy Green. Amy had noted when doing chart reviews over the last three months prior to this incident that there were issues of short staffing and that many nurses were working double shifts, evenings and nights then coming back and working the evening shift. She was in the process of collecting data from the different units on this observation. She also noted a pattern of using float nurses to several units. Prior to this incident the clinical nurse specialist, Michael Parks, RN, MS, CNS, was consulting with Susan Post and Amy Green about the status of staff education on this unit and what types of resources and training was needed.
Legal Aspects in Nursing Sample Answer
Legal Aspects
Introduction
In their practice, nurses encounter various ethical and legal aspects that may implicate them in legal tussles. When new treatments are used, issues of informed consent to treatment and balancing between benefits and risks tend to be challenge in resolving them. Understanding aspects concerning informed consent is, therefore, important as patients are assisted on how to ask questions and to understand the information they need to fully and truly be aware of the treatment choices available to them (Moffett & Moore, 2011). Similarly, assessing aspects to do with benefits and risks of any experiment treatment option is critical for long term health of the patients. This paper, therefore, deliberates on the various aspects relating to informed consent and risks versus benefits as well as legal constructs involved. The paper adopts a case study on Malpractice action brought by Yolanda Pinellas.
Standard of care
Under the law, any individual under the duty of care is required to have a degree of prudence and caution when undertaking their duties. Nurses and any clinical officers are under duty of care to provide medical treatment based on the scientific evidence and to collaborate with other medics involved in the treatment of any health condition (Moffett & Moore, 2011). Practitioners have a duty to inform the patient about any fiduciary interests or material risks of the physician that may make the patient to reconsider the procedure (Moses & Feld, 2008). Failure to do this means that the physicians will be liable for any risks that the client or patient may suffer. In the case of Yolanda’s, the medical practitioners attending to her failed to inform her about the dangers inherent in using Mitomycin in her chemotherapy. Furthermore, the medical officer failed to inform her that the hospital was testing a new IV infusion pump by the name SAFE-INFUSE. This was, therefore, a mistake on the side of the medics and the ordeals and sufferings that Yolanda went through were as a result of lack of informed consent. This caused her to be exposed to the risks. The medics are, therefore, liable for breaching the standard of duty.
Duty, breach, damages and proximate cause
Duty, which is the obligation of one person to another, is something that unifies a society. In medical field, the nurses have a duty to provide quality care to the patients’ failure to which it amounts to negligence (Owen, 2007). Breach is another element of negligence and misconduct such as omission and improper act towards another person. Proximate cause ensures that there is logical act and fairness in judgment. A defendant in proximate cause is liable for failing to foresee a problem or harm in his or her course (Find Law, 2014). Damage, on the other hand, is when the defendant fails to take necessary precautions leading to harm on the patient or plaintiff. In this case, of Yolanda, it is evident that there was breach of duty, damage and proximate course. The medical practitioners had a duty to ensure that Yolanda is well treated and always check the progress of the medication something that the hospital failed. They did not mind checking the beeping sound; they also failed to record the serial number of the pump. They knew that they were carrying out an experiment of the safe-infuse PUMP but went ahead to use it on Yolanda. They also knew that the nurses were not enough and lacked enough training and went ahead to admit the patient. Therefore, they could have avoided all these mistakes and taken their responsibility to provide quality care these problems could not have occurred.
Preparation for court of the parties
Yolanda has a right to take the matter in the court to be compensated for these breaches. The medical practitioners and the hospital breached his rights to informed consent on the risks and benefits of the treatment. They failed to inform her of any risks and benefits about the treatment. This information could have enabled her to make an informed decision of whether to attend the procedure at the facility or not. She needs to note main points and issues in the case, prepare a detailed outline of important aspects that the judge will need to know, and then back it up (International Court of Justice, (2014). She should also get a good witness to provide factual evidence against the medics and the hospital (Family law, 2012). When presenting the facts, she should stick to the facts she prepared to ensure that she explains clearly to win the case.
This assignment requires you to read “Moral Criticisms of the Market” by Ken S. Ewert Note that in his article, Ewert is defending the free market from “Christian Socialists.” He states their position and then gives a rebuttal. Do you agree with the critique of the market in Ewert’s article? Why or why not? Read carefully and offer cogent reasons.
Consider the context of the article; the Berlin Wall fell months after the article was published. The USSR followed shortly thereafter.
SAMPLE ANSWER
The Free Market System
In his article Moral Criticisms of the Market, Ewert (1989) looks at the condemnation of the free market by Christians as morally wanting and criticizes it. I agree with this article on various points.
First, he accepts that most systems accommodate selfishness. It is for this reason that both a socialist and a capitalist will both take a bribe. However, the free market system does not encourage selfishness. Instead, the free market system promotes competition. Competition on the other hand, competition has been shown to promote productivity. It is of course the intention of every system to encourage productivity.
Second, the free market encourages free choice. This way, it does not encourage individuals to market their products selfishly but rather gives them a chance to act as they please. The socialist approach on the other hand gives the will to a central system. This system is to blame for the Berlin wall. The Berlin Wall was intended to divide the socialists in Germany from their capitalist counterparts (Taylor, 2007). It took away the concept of free will from individuals forcefully. This implies that capitalist systems are more likely to promote free will and peaceful co-existence than socialist ones.
Thirdly, the socialist systems are intended to benefit one party while neglecting others. The alternative to the free market is the state-led systems. These systems often permit for the creation of channels that promote the oppression of certain individuals rather than others. This implies that they are more likely to be oppressive compared to capitalist systems.
Finally, the free market does not give any reasonable economic power to the wealthy. The economic power it confers to the wealthy is the ability to negotiate. Since they have money, they are able to offer better terms to those from whom they are buying from. It does not however promote cases of slavery and oppression.
Compare/Contrast the worldview of the Religious Right, at the time of its founding, to your current worldview. Your answer must be at least 250 words.
SAMPLE ANSWER
Christian Worldview
With its origin in the early eighties, the Religious Right was initially an amalgam of Evangelical Pentecostals. It initially emerged from the biblical higher criticism in the theological colleges and divinity schools, the teaching of Darwism in public schools system, the existing and or perceived threat of communism. The Religious Right thus includes Catholics, Jews and Mormons who hold very conservative views on politics in addition to the occasional Secularists. This have joined together and taken over the Religious Right. The Religious Right can thus be said to be a the meeting point between the evangelicals with a penchant for politics and were bold enough to politicize the pulpit and the non-evangelicals who saw the opportunity to work with the religious to play politics.
One can thus draw the conclusion that the Religious Right increasingly finds that political goals are the overarching aspects that gel them together. This can be traced to the changes that happened in the early and late 60’s that affected the national psyche – civil rights conflicts, Vietnam protests, the alternative youth culture, the women’s liberation movement, the sexual revolution, and the rise of the new religions (ancient religions emerging from obscurity) (Hansen, 2008). When the glue that joins Religious people together changes from the word of God to politics then society is going down a slippery road – in 1962, the Supreme Court banned prayer and bible reading in schools, legalized first trimester abortion in 1973 and regulated government involvement in private Christian academies.
Presently, the Religious Right is based on four cornerstones; the assumptions, that moral absolutes exists as surely as mathematical or geological absolutes, that metaphysics, morals, politics and mundane customs stand on a continuum, that government’s proper role is to cultivate virtue, and not to obstruct the activities of the marketplace, and that all successful societies need to operate within a framework of common assumptions (Hansen, 2008). This explains why liberals are increasingly major actors in the present Religious Right.
References
Hansen B. S (2008). Religion and Reaction: The Secular Political Challenge to the Religious Right, Rowman & Littlewood Publishers, Inc., Plymouth, UK.
We can write this or a similar paper for you! Simply fill the order form!
for this paper, the writer has to follow proper instructions and use examples that have been giving to complete this paper. The paper has to be in the format of the examples, but must be writing base on the propose policy proposal that we are working on that is also included hear in the instructions and the questions.
Policy Change Options
Three existing policy change options include incremental change, major change, or to do nothing. An incremental change, like most U.S. health policy change, would occur when policymakers limit themselves to a small subset of strategies to account for a lack of time or capacity in a highly complex and resource-intensive decision (Mason, Leavitt, & Chafee, 2014). A major change would include a larger-scale, more radical policy change. Finally, selecting the option to do nothing means that no change will be made to the policy.
Reference
Mason, D., Leavitt, J., & Chaffee, M. (2014). Policy & politics in nursing and healthcare (6th ed.). St. Louis, MI: Elsevier Saunders.
Explain three pros and three cons for each policy change option relating to your propose policy change proposal hear below.It is critical that the pros & cons are clearly writing in an expository manner with just enough information to understand your change.
The public policy problem is that section 2713 requires organizations to provide their workers with birth control as part of their insurance coverage. The public policy question is: should the federal government mandate that organizations can choose whether or not to provide contraceptive services to employees as part of their insurance coverage? The public policy resolution is an amendment to section 2713(a) (4) of PL 111-148 that would say: organizations – both for-profit and non-profit organizations – have the option of either offering their employees birth control as part of their insurance coverage or not to offer contraceptive services (Cauchi, 2014).
Here is an example of what the response is supposed to look like, but it should be based on the above propose policy change and not the one use hear in the example. This example is just to show the writer how to response to the paper. It is critical that the pros & cons are clearly writing in an expository manner with just enough information to understand your change.
Example of the pros and cons and how the paper will look like at the end, but it should be based on the above propose change.
Pros and Cons for Policy Change Options
Pros for the Option to Do Nothing
1. If nothing is done, the training demonstration program will offer support to family nurse practitioners.
2. If nothing is done, there will be no additional funding required.
3. If nothing is done, the policy will be implemented without delay.
Cons for the Option to Do Nothing
1. If nothing is done, nurse practitioners specializing in adult/gerontological care will not be included as part of the training demonstration program.
2. If nothing is done, the training demonstration program will only offer support to family nurse practitioners.
3. If nothing is done, there may not be an increase in adult/gerontology nurse practitioners to care for the rapidly growing elderly population.
Pros for the Incremental Change Option
1. An incremental change will allow for more time and resources to support the amendment.
2. An incremental change will allow for greater success in producing a nurse work force specializing in adult/gerontological advanced practice care.
3. An incremental change will allow the government time to make adjustments to the budget in order to support the inclusion of adult/gerontological nurse practitioners in the grant demonstration program.
Cons for the Incremental Change Option
1. An incremental change may allow for policymakers to repeal section 5316 of the PPACA.
2. An incremental change will take a longer period of time to implement than a major, radical change, or the option to do nothing.
3. An incremental change will require increased spending as the amendment will be evaluated and adjusted after implementation.
Pros for the Major Change Option
1. A major change will provide clinical training for adult/gerontological nurse practitioners, enabling them to serve as primary care providers in federally qualified health centers and nurse-managed health clinics.
2. A major change can be implemented immediately.
3. A major change will result in an increase in adult/gerontology nurse practitioners to care for the rapidly growing elderly population.
Cons for the Major Change Option
1. A major change may encourage nurses to pursue a career as an adult/gerontology nurse practitioner who are not committed to practicing in the specialty.
2. A major change will result in an immediate increase in government spending within the grant demonstration program.
3. A major change will result in opposition from advance nurse practice specialty groups (other than family nurse practitioners) who wish to be included in the grant training program.
Policy change is the action of changing how a particular task is done. The change can be incremental, major, or plainlyto do nothing at all.Adopting any of these change options has both pros and cons, though in varied measures.
Pros for the Option to Do Nothing
By doing nothing, the decision will save money, especially for the organization to carry out the incorporation of the provision of contraceptives to its employees. An example is when Obama ignored all the warnings from the medical trusteesabout the Medicare being expensive.
In addition, not to do anything will ensure that organizations do not experience deficits every year due to supplementary medical insurance trust fund. This could lead to the organizations not being financially stable.
Moreover, the ‘to do nothing’ will save the future of the organizations. By providing contraceptives to its employees, the organizations might experience double the debt it already has.
The ‘not to do anything’ approach will prevent fiscal imbalance in the organization. The organization will not reduce employees’ salaries in order to provide the contraceptives to every employee(Mason, Leavitt, &Chafee, 2014).
Cons for the Option to Do Nothing
If nothing is done, the company will not spend any money on offering contraceptives to its employees
In addition, the employees will not receive the contraceptives from their employers, hence, not enjoy complete health insurance cover.
Moreover, the organization will not be able to control the birth rate of its employees, hence, leading to increase in expenditure.
Pros for Major Change
Major change will ensure that more organizations are adopting the public policy of providing contraceptives to their employees.
In addition, major change will provide more sensitization to the organization on the relevance of providing contraceptives to its employees. This will in turn enhance more provision of health care.
It will also ensure immediate implementation of the public policy, hence, faster provision of the healthcare.
Cons for major change
Major change will translate to opposition from some of the organizations, which do not have enough funds to provide each employee with contraceptives as part of their insurance policy.
In addition, it will also mean more expenditure on the part of the government in providing contraceptives to nonprofit organization.
In addition, it will promote provision of contraceptives to the employees by the organizations whose interest is not in the provision of such services.
Pros for Incremental change
When companies adopt the incremental change in implementing the public policy, it will allow for more time and resources to support the policy of every organization providing contraceptives to its employees.
In addition, the whole process of providing contraceptives to every employee as part of the health insurance policy will be very successful in both the profit and nonprofit organizations
Moreover, the organizations will have more time to make adjustments to their budgets to cover for all the employees. This will ensure no stopping in the whole exercise of providing contraceptives to its employees.
Cons for incremental change
Incremental change will allow the legislators convenient time to amend the policy to suit all the organizations in the provision of the health care insurance cover to its employees.
Consequently, incremental change will consume more time in its implementation as compared to major change and not to do anything change.
In addition, the whole process is very expensive due to many changes from time to time. This might lead to the whole process of implementation not being very successful (Cauchi, 2014).
For this paper, the writer will be combining 111486,111516 and 111587 , plus the writer will include an executive summary. The writer will end the paper by responding to the points listed below. It is important that the writer take proper care and combing the paper following the instructions below as it will not come out right if proper instructions are not followed.The executive summary must be base on the entire paper.
In combining the paper , we have to start from the first week which is 111486 and then follow by 111516 and then 111587 and finally he will include the respond to the section below following the instructions giving below for the summary, making one complete paper.
Your entire Paper is due this week. You should combine all information gathered over the past 3 weeks into one organized, cohesive report. You should also include a brief executive summary and set each week’s content in the context of the relevant literature. End the paper by responding to the following:
• Identify at least three short-term steps that the company can take to improve its overall marketing effectiveness. Provide details of specific activities in which the company should engage.
• Identify at least three long-term steps that the company can take to improve its overall marketing effectiveness. Provide details of specific activities in which the company should engage.
• In addition, include a discussion of the importance of the marketing audit that references scholarly literature and explain how the audit can help a company identify key issues.
Remember to include all references (in correct APA format), both scholarly and first-person interview, that you have used in your research.
SAMPLE ANSWER
Abstract
This paper provides a macro-environment audit of a selected company, which is Nike, Inc. The external influences that affect Nike including the demographic, economic, environmental, political, as well as cultural factors are described in an in-depth and comprehensive manner in this paper. These factors cannot be controlled by firm and at times they present threats. Nonetheless, changes within the external environment of a firm also create new opportunities (Kotler & Keller, 2012). The person whom I intend to interview is Davide Grasso, the Vice President, and Global Marketing manager at Nike.
Executive Summary
Nike, Inc is one of the multinational enterprises in the United States of America that designs and also manufactures sports apparels, foot wares, equipments among other accessories. Its major production subsidiary is Converse Inc, a company that specializes in designing and distribution of casual apparels, foot ware, and other personal sports outfits. Hurley International Company, specialiases in designing, marketing and distribution of sports ware and equipment for the youth.
Nike has adopted a wide range of marketing and communication strategies that have enabled it to achieve a lot of success in its marketing activities and revenue volumes. Despite its successes, Nike has also suffered setbacks in its journey to success. Nike had to contend with several accusations of child labour abuse and wage exploitation in parts of Asia. Several strikes have also hit some licensed contractors working for Nike in China.
These activities have affected the marketing effectiveness of Nike’s products in several countries especially those countries that uphold fair treatment of employees and respect for the rights of employees to a safe working environment.
Demographic Factors
Nike makes its products not only for women and men, but also for children of all ages. The target market for Nike’s products comprises females and males who are between the age of 18 years and 35. This age-group continues to increase every year, which presents a major opportunity for Nike’s products. People of all ages today are more health conscious than they used to be in previous years. As such, increasingly more people are actually choosing to join fitness clubs. Consequently, there is an accompanying growth for demands of fitness products particularly exercise equipment, shoes and apparel (Nike, 2014). Nike can position itself to exploit the opportunity brought about by this increase in demand as younger and older people are looking for sports equipment, apparels and shoes. Moreover, the female’s athletic market is also on the increase as the number of collegiate athletes have risen considerably from just a few thousands 5 decades ago to nearly 1 million at present (Nike, 2014).
Economic Factors
In response to the recent economic developments and trends characterized by a slowing economy which has caused consumer purchases to reduce, Nike has been greatly affected. Material prices and labor costs increased. The economic recession, which was the company’s biggest threat, resulted in weak sales for Nike (Nike, 2014). The actions that Nike is taking in response to the recent economic recession include increasing sales in China which experiences robust economic growth. In essence, sales in the Chinese market and in other parts of the globe were used by Nike to make up for weak sales in Europe, Australia, Japan and North America. Not only did Nike use the Chinese market to fight recession, but it also cut a total of 1,750 jobs. Nike also cut its marketing during the recession (Rogoway, 2009).
Environmental Factors
To make its products, Nike is presently reliant on the availability of natural resources including energy, water and raw materials. The cost of competition for these resources would rise as these resources become more and more scarce (Nike, 2014). Greenpeace reported that Nike had relationships with 2 Chinese textile processing factories that were producing dangerous chemicals and polluting 2 of China’s major rivers with chemicals that were hazardous (Hunt, 2011). With regard to the steps taken by Nike on the subject of pollution and conservation, Nike is committed to delivering innovative new products in ways that are more sustainable. To properly manage scarce resources, Nike develops and uses more sustainable and more recycled materials, as well as leaner manufacturing processes (Nike, 2014).
Technological Factors
Product innovation is essentially a continuing process and is of major importance to staying ahead of the competition (Oliva, 2006). In this industry, corporations invest considerably in Research and Development so as to sustain the new demands of today’s contemporary athlete. Nike has employed a lot of specialists who include athletes, industrial designers, engineers, as well as biomechanics to collaborate in the design process (Nike, 2014). Product technology generally has to evolve as fitness also evolves so as to gain an advantage. It is of note that Nike introduced into the market Nike Shox, a product that greatly revolutionized the cushioning foam utilized in shoes. In addition, Nike also worked together with Apple in launching new footwear and apparel that would easily carry the iPod of the consumer (Nike, 2014).
Political Factors
There are several changes in regulations and laws that may affect marketing strategy and tactics used by Nike. Several states such as Ohio have established Environmental Pollution Agencies (EPA) pollution control laws that are designed to prevent environmental pollution and generally to protect the environment (Esworthy, 2013). Such federal and state laws on pollution greatly affect Nike’s marketing tactics and strategy. The United States Government has also put in place price controls on prices which could be charged for services and good within the marketplace. Such price controls are mainly aimed at maintaining the affordability of products, and to slow inflation. Moreover, the Consumer Product Safety Act gives the Consumer Product Safety Commission the mandate to formulate safety standards and pursue recalls for goods which present significant or unreasonable risks of death or injury to consumers (Esworthy, 2013). The laws on Equal Employment Opportunity (EEO) forbid specific kinds of work discrimination in some workplaces. In the United States, the Federal Trade Commission regulates and oversees marketing and advertising law. These laws could possibly impact many of Nike’s areas of business, for instance how the company labels its products, how it carries out telemarketing and email campaigns, and how Nike advertises to children (The U.S. Small Business Administration, 2014). Laws on advertising protect consumers by demanding that advertisers should be truthful regarding their products and be able to validate their claims.
Cultural Factors
Nike’s brand is one of the most recognizable worldwide. The public’ attitude towards Nike’s products is that they are expensive, particularly the sneakers, and are of high quality. They are also durable products. However, a new reasonably priced series of Nike products for consumers in Asia made Asian consumers to think of Nike’s products as affordable. Changes in customer lifestyles such as doing more exercise to keep fit might affect Nike since there might be an increase in demand for the company’s sports shoes, apparel and equipment.
Markets
The major market segments of Nike Inc are mostly located in North America, Western Europe, Japan, China and other emerging markets. The markets have been expanding globally as well as the volume of sales. In 2013, the operations grew by 11% as a result of the popularity of the Nike brand and all the segments except China registered improved sales in the year 2013. In the same year the total sales turnover were $20.117 billion while the assets and liabilities for the same period were $17.584 and 6.428 billion respectively. The total market capitalization for Nike Inc. amounted to $64.75 billion in 2013. The inventory turnover for the same period was 4.3 compared to the previous year which was 4.3. The total revenue for Nike Inc for the year ended 2013 amounted to $27.8 billion
Customers
North American is the leading market segment in terms of sales volume which is followed by the emerging markets and China. The other markets are Western Europe, Japan and Central and Eastern Europe. Most of the segments make majority of their sales through wholesale outlets. Nike Inc products are highly rated both by its direct competitors like puma, Reebok or Adiddas and its customers. The Nike’s + sports band is a type of shoe that is universally rated as one of the best basketball shoes globally. It records or provides the distance covered when running and also the time taken. Nike brand is also common with the youth culture especially the urban fashions.
Competitors
Nike Inc is the leading company in footwear industry and it controls about 47% of the entire footwear industry while Reebok and Adidas control 16% and 6% respectively. Reebok is the second largest manufacturer of footwear in the US after Nike Inc. Adidas market capitalization for the year 2013 was 15.55 billion while its quarterly growth rate is 2% compared to Nike’s 11% for the same period. The total revenue for Adidas for the year ended 2013 amounted to 18.59 billion as compared to Nike’s $27.8 billion for the same period. Nike’s operating margin was 0.13 compared to 0.07 for Adidas for the same period while the earnings per share were 2.93 and 2.2 for Nike and Adidas respectively. The gross operating margin was 0.45 for Nike compared to 0.49 for Adidas. (Nike, 2014)
Adidas is enjoying one of the fastest growths in brand expansion. Their positive attributes have been shielded from any form of bad publicity by the two largest brands that are Nike and Reebok. (Van de Ven, 2008) They adjusted and expanded their manufacturing operation strategies to specialized outsourced services in the early 60’s from Germany to cheaper economies in Asia. But their greatest weakness is that they still do not have an operation code of conduct for outsourced agencies like Nike and Reebok. (Nike Annual Report, 2013) Adidas is currently considered to the worst employer in footwear industry and it’s largely due to its subcontracted or outsourced work in outsourced factories in Asia. (Van Dusen, 1992)
Distribution and Dealers
The largest earners for Nike Inc are the wholesale distributors which control majority of its sales volume. The inventory turnover or efficiency ratios for the year 2013 was 4.3 compared to the previous year which was 4.3 while the total revenue for the year ended 2013 amounted to $27.8 billion. Nike has outsourced most of its manufacturing business to China and other parts of Asia. Nike Inc also operates thousands of retail outlets in North America and also in other selected countries globally. The future ordering service or program facilitates the retailers to receive advance orders from customers and deliver them when they are due. In 2013, 87% of all the US sales were made under this program. (Kotler & Keller, 2012)
Nike also sells its products through their own Direct to Customer sales operations by utilizing the services of mix independent distributors, sales representatives globally and other licensees. Nike also operates the NIKETOWNS and other outlets for their employee-only stores. (O D’Esopo, & Almquist, 2007)
Suppliers
The suppliers of Nike are mostly located in Asia and other parts of the world. All the footwear for Nike is manufactured outside the US. China and Vietnam manufacture 36% each of Nike’s footwear production while Indonesia and Thailand manufacture 22% and 6% respectively of the total production. (Nike Annual Report, 2013) Other factories that manufacture for their primary markets are located in Argentina, Brazil, Mexico and India. The major suppliers of Nike’s raw materials which are generally canvas, leather, nylon and polyurethane that is used to manufacture the Air-sole components are from China and Thailand. Since the year 1972, Sojitz International Corporation of America and Nissho Iwai Corporation from Japan has handled the bulk of Nike’s raw materials in the form of importing and exporting the requirements of the major production facilities across the world. They also finance the some of the operations and also handle the transporting logistics for the subcontractors.
Facilitators and Marketing Firms
Nike operates its marketing strategy by sponsoring celebrity athletes, college teams and other international professional teams to market its branded apparels and footwear. Nike has an agency known as the Wieden + Kennedy popularly known as the W+K and its responsible for creating its advertisements on most broadcasting stations and features mostly on the New York marathon and other international events. (Lee & Broderick, 2007) Nike has won several accolades in the international scenes due to its effective advertisement including the Emmy advertisement awards and also in the Cannes awards events. Nike pursues an aggressive marketing policy that favors its quality products. (Hauser, 2007) The core competencies of most footwear industries is to provide quality footwear and they concentrate largely on the research and development of their products while they leave the production and manufacturing operations to outsourced contractors. The main companies form the policies that guide the technological expertise, marketing and distribution networks. These companies gain in the form of reduced capital needs and risks, lower wages and management requirements when they outsource their manufacturing operations.
In conclusion, Nike has adopted several communication strategies to market its products and also to track vital information from the internet and also from other broadcasting stations. (Schibrowsky, Peltier & Nill, 2007) Internet marketing and other email technologies are utilized by Nike to reach potential clients throughout the world. The revenues for Nike Inc have continued to rise despite economic challenges that exist globally.
Marketing Function Audit
13.1. Products
Nike’s product line objective is based on performance oriented strategy that seeks to manufacture foot ware’s and sports apparels that can endure the rigorous training and competition pressures to achieve top most performance for their clients. For clients who purchase the products for casual use, Nike Inc aims at providing the best apparels and foot wares that is based on extensive research on personal performance and comfort.
Nike Inc product and brand overall strategy is mostly based on sports performance where a major of its revenues are derived from. But the overall casual market for its products is far larger than the sports market. More product branding and strategy should be focused on the casual market to achieve higher sales on the emerging market.
13.2. Price
Nike’s pricing objective are based on the competitive market that also aims at providing the best sporting and casual foot ware and apparel in the market. Nike products are priced slightly higher above its competitors due to its products higher quality and endurance aspects of its products. Its pricing policy is based on value for the price offered but occasional its marketing strategists conducts assessments on the overall market reaction to its prices in various parts of the world using different sampling procedures especially in the US which provides almost 45% of its total revenues.
13.3. Distribution
Nike’s Converse Inc specializes in designing and distribution of casual apparels, foot ware, and other personal sports outfits for the general public and sportsmen while Hurley International Company, specialiases in designing, marketing and distribution of sports ware and equipment for the youth, colleges and other sports events for teenagers. Besides the wholesale customers, Nike also sells directly to customers through the Direct Consumer Operations. Nike has a global presence in most of the countries worldwide and its marketing strategy is very effective and adequate. (Beverland, Napoli & Yakimova, 2007) Its product is available to most of its consumers globally besides the normal orders that can be placed under the Direct Consumer operations. (Hauser, 2007)
Integrated Marketing
Nike has won the Emmy Award for best commercial on two occasions in the years 2000 and 2002. (Nike Annual Report, 2003) Its advertising objective is to create a trademark that is associated with excellence performance in the track and field for athletes and other sportsmen and women and also for casual use.
The advertising media for Nike is well chosen and effective. The decision to use sports celebrities to market and promote its products and also to demonstrate the performance of their technology and design is proving to be the best decision. Nike Inc signed in the NBA player Mike Jordan, in the year 1984, and its revenues increased dramatically hence the introduction of the Jordan brand name in one of its foot ware products. (Beverland, Napoli & Yakimova, 2007) Nike adopted the internet and email marketing management technologies since its inception in the early 2000 and it’s currently using the broadcast and narrowcast satellite communication technologies to drive its multimedia marketing campaigns. (Schibrowsky, Peltier & Nill, 2007; Szmigin, Canning & Reppel, 2005)
Strategy Audit
15.1. Business mission
Nike business mission is clearly stated in market oriented terms and represented wholly by its trademark in all its designs. (Nike Annual Report, 2013) In the year 2010, the value of its brand alone was estimated to be worth more than $10.7 billion. Nike’s brand name is very feasible and it actually leads its sales. Its trademark represents all its mission strategies and accomplishments.
15.2. Marketing Objectives and Goals
Nike’s marketing objectives and its goals are well stated, adequately enough to plan its marketing and performance operations to facilitate global expansion and achieve highest returns. Nike’s athletic foot wares for example, are aimed at providing specific athletic use and they have been designed with the same purpose in mind. (Prahalad & Ramaswamy, 2004)
The company’s objective is appropriate given its competitive nature and huge resources and opportunities available. These can be confirmed from its huge revenues that are derived from its sales revenues and the popularity of its products. In the year 2012, Nike posted more than $24.1 billion dollars in its total revenues.
Strategy
The management of Nike Inc has a clear strategy of achieving its marketing objectives. The US forms its target segment with an estimated 45% of its entire revenues coming from the US alone; its major strategies are tailored for the American market. Product positioning refers to the development and marketing of the company’s products brand as the true and real images of the company’s major product. (Kotler & Keller, 2012) To form an impressive strategy, Nike has chosen a communication strategy that is unique and competitive to the nature of its products. The use of sports celebrities as its promotion strategy has created an effective marketing strategy. (Nike, 2014) Most of its customers view the Nike brand as an epitome of success something which influences its pricing policy. (O D’Esopo & Almquist, 2007). It’s a process known as brand equity and it occurs where the company’s loyal customers are even more willing to pay much more to obtain their choice of product mostly because of its positioning in the market.
To perfect the effectiveness of Nike’s marketing strategy, the short term measures that the company can take is to polish its tainted image on allegations of child labor in Cambodia and Pakistan and which were first registered in the 1990’s. The allegations were once again confirmed by the BBC in the year 2001 who gave an account of six girls who worked more than sixteen hours a week continuous for weeks on end and without adequate compensation. Also in April 2014, a strike in China almost grounded the operations of Yue Yuen Industrial Holdings in Dongguan that was occasioned by poor pay and inhospitable working conditions. The company is a Subcontractor of Nike Inc. Nike has to prove to the world that it’s an equal opportunity employer and its policies are not discriminatory on the basis of race, gender or nationality. Issues of exploitation can gravely taint its image and can have very negative repercussions on its brand image globally. The company must have a way of reigning in its errant Subcontractors who exploit the workers notwithstanding the political factors that may be at play in such countries.
One of the marketing strategies that Nike has adopted is the promotion of its product by using successful sportsmen as way of promoting its products worldwide. Most of these sports celebrities don various apparels that are branded with Nike’s trademarks and which associate success to with Nike’s products. However, there are instances where the motive of Nike’s major objective of portraying success has been marred by the celebrities negative immoral and unethical behaviors’ like in the case of Tiger woods’ unbecoming conducts outside the field. Nike Inc needs to do more on researching their sports celebrities before contracting them so as to improve the effectiveness of its marketing policies and communication strategies.
Nike also needs to improve on its efficiencies in the production process and conduct more research on affordable raw materials that can be costed affordably. Its pricing policy is way above most of its potential customers. Nike’s products are more expensive than its rivals Adiddas and Reebok. For its marketing strategies to be more effective the prices of its products must also resonate well with its potential clients.
The long term measures may include more research on improvement of the sportsmen needs and the latest demands on consumer tastes and preferences. For Nike to maintain a sustainable, competitive and effective marketing strategy efficient methods of evaluation and feedback analysis must be established and the objectives clearly defined.
The log-term measures should include an effective promotional strategy that will entail long-term research on all potential sports celebrities and those that aspire to promote the products of Nike Inc. These measures will ensure that the risk of recruiting incompetent, hot tempered or immoral promoters would be minimized. Cases like the suspension of Oscar Pictorius due to negative publicity would have been avoided much earlier before the revelation or publicity of Nike’s sponsorship details in February 2013.
Cases of inadequate and ineffective advertisement should also be addressed by adopting clear communication strategies. Competent and experienced promotional designers should be hired to design and develop effective marketing materials that are required for long-term marketing strategies. In some cases Nike had to withdraw some advertisement from the market after some of their marketing phrases were offensive to the public like the Nike 6.0 advertisement. (Brettman, 2011)
Discussion of the Importance of the Marketing Audit
The marketing audit has revealed the marketing activities of Nike Inc, its business environment and also assessed its present and past performance. It has also provided the basis for analyzing its marketing strategies. As the dynamic nature of the marketing and business environment is always changing, the marketing audit report can be used as a point of reference or as a tool of reflecting the constant changes in the business environment internally or externally. External environment reveal the changing patterns of the industry’s competitors compared to the company’s development and growth. The external environment audit also reveals the effects of government policies like taxation and trade policies on the company. The internal audit reveals the effectiveness of the company’s marketing strategies and also the marketing information research.
Conclusion
To conclude, the main aim of Nike’s marketing strategy should not only be business expansion only but also it should include corporate social responsibility both to its immediate environment and also for future generations. A short-term victory against its rivals or competitors would be great for the company and its management but the major aim of the company should be to maintain a sustainable and a competitive advantage over the rest of the firms in the industry
Beverland, M., Napoli, J. & Yakimova, R. (2007) Branding the business marketing offer: Exploring brand attributes in business markets. Journal of Business & Industrial Marketing, 22(6), 394–399. Doi: 10.1108/08858620710780154
Esworthy, R. (2013). Federal Pollution Control Laws: How are they Enforced? Federation of American Scientists.
Hauser, W. (2007) Marketing analytics: The evolution of marketing research in the twenty-first century, direct Marketing, 1(1), 38–54. Doi: 10.1108/17505930710734125
Hunt, K. (2011). Greenpeace Links Big Brands to Chinese River Pollution. BBC News.
Kotler, P. & Keller, K. (2012) Marketing management, Upper Saddle River, New Jersey: Pearson Prentice Hall.
Kotler, P. & Keller, K. (2012) Marketing management, Upper Saddle River, New Jersey: Pearson Prentice Hall.
Lee, N. & Broderick, A. (2007). The past, present, and future of observational research in marketing. Qualitative Market Research, 10(2), 121–129. Doi: 10.1108/13522750710740790
O D’Esopo, M., & Almquist, E. (2007). An approach to mastering the marketing mix. Business Strategy Series, 8(2), 122–131. Retrieved from Proquest Central database.
Oliva, R. (2006). The three key linkages: Improving the connections between marketing and sales. Journal of Business & Industrial Marketing, 21(6), 395–398. Doi: 10.1108/08858620610690155
Prahalad, C. & Ramaswamy, V. (2004) Co-creation experiences: The next practice in value creation. Journal of Interactive Marketing, 18(3), 5–14. Retrieved from Business Source Premier Data base.
Schibrowsky, J., Peltier, J., & Nill, A. (2007). The state of Internet marketing research: A review of the literature and future research directions. European Journal of Marketing, 41(7/8), 722–733. Doi: 10.1108/03090560710752366
Szmigin, I., Canning, L. & Reppel, A. (2005) online community: Enhancing the relationship marketing concept through customer bonding. International Journal of Service Industry Management, 16(5), 480–497. Doi: 10.1108/09564230510625778
Diffusion of Innovation and Diffusion of Innovation Models
Order Instructions:
Can Technology + Behavior Be Diffused?
post a brief description of a population segment (by race, ethnicity, economic status, geographical location, etc.). Then, explain the relationship between health inequality/inequities and common biological or behavioral risk factors that have been linked to a particular disease in that population segment. Finally, describe the relationship between health inequality/inequities and life expectancy for that population.
SAMPLE ANSWER
Diffusion of Innovation
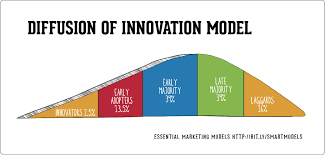
The diffusion of innovation concept attempts to explain the extent to which innovations are adopted in a population. Innovation is explained as an idea or behavior perceived as new by its audience. Diffusion of innovation provides some valuable understanding of social change. It explains the qualities that make an innovation spread, how essential is peer to peer conversations and peer networks and in understanding the demands for other different users. Behavioral and technological factors influences innovation diffusion and it spreads through social networks. Certain innovation spread more quickly due to its relative advantage, its compatibility with the existing value and practices, how simple it is and to use and the observable outcomes ( Bird, Conrad, Fremont, & Timmermans, 2010).
Evidences suggest that the differences in racial/ethnicity in death rate are linked to socioeconomic resources because of the data available. Most of the evidences are found on the health experience of the blacks and white in understanding racial or ethnic inequalities.
The potential power of the socioeconomic status image in realizing health inequalities including racial or ethnic disparities is apparent in the fact that socioeconomic differences in health results have been widely documented for most health conditions in most countries.
The individuals who suffer from the diseases such as physical impairedness and experience higher mortality rate are those who are poor and with less education (Bird, Conrad, Fremont, & Timmermans, 2010). In the United States, those who are better off have fewer health problems and some of their health conditions are sensitive to socioeconomic status. The differences in racial and socioeconomic are greater in some proportions of health. For instance, the death rates from heart diseases are higher in black men than in white men, but they do not disagree in the wide spread of the reported heart disease (Gee, Walsemann, & Brondolo, 2012).
The relationship between the socioeconomic status and health changes by age because of the differential relationships between the disease and socioeconomic status. The mortality rate in young adults is majorly prevailed by AIDS and violent deaths that are related to socioeconomic status. Deaths from of heart disease and cancer are prevalent in the middle adult ages (Killewo, Heggenhougen, & Quah, 2010). Early deaths from these causes may be among those with either high vulnerability or lifelong insult. The causes of death and many causes of disability that dominate old age have a long period of development. The mortality rate is not the same as the racial/ethnic differences in disability (Gee, Walsemann, & Brondolo, 2012).
Some factors of health are completely beyond the human ability to determine and, therefore, make it difficult to work towards complete equality in health. Equity implies some aspects of social unfairness. Therefore, in case a population more youthful than the other dies due to inherited differences, which is a non- controllable factor, it may be conclude that it is a health difference. On the other hand, the situation would be classed as health inequity if the life expectancy of the population is lower due to lack of access to proper medications. These unfairness cases may include the differences in the existence of diseases, and access to an hospital or health results between the populations, which has a different race, ethnicity or socioeconomic status.
References
Bird, C. E., Conrad, P., Fremont, A. M., & Timmermans, S. (2010). Handbook of Medical Sociology, Sixth Edition. Vanderbilt University Press.
Gee, G. C., Walsemann, K. M., & Brondolo, E. (2012). A Life Course Perspective on How Racism May Be Related to Health Inequities. American Journal of Public Health, 102(5), 967-974.
Killewo, J. Z. J., Heggenhougen, K., & Quah, S. R. (2010). Epidemiology and demography in public health. San Diego, CA: Academic Press/Elsevier.
We can write this or a similar paper for you! Simply fill the order form!
Although Canada is contiguous to the United States and has some cultural and historical similarities, Canada’s population enjoys a vastly superior health status. Reasons are many, can be traced historically, and are related to a different view of the role of government. The experience of Canada demonstrates that neither a heterogeneous population, nor a health system that has waiting lines for services, are reasons for poor health. By looking critically at what produces good health in Canada, much can be learned about steps the U.S. might need to take if population health is its goal.
The Canadian Best Practices Portal challenges Canadian public health practitioners and researchers to create upstream interventions aimed at the source of a population health problem or benefit. What is being done to address the influences on population health in Canada?
Search the Internet and scholarly research for examples of Canadian “upstream interventions” that can be put forth as examples of either effective or ineffective efforts to improve population health. This is a 4-5 pages):
The Assignment (4-5 pages):
1. Provide a description of an existing intervention in Canada, intended to improve health inequities. Include an explanation of the inequity and how the intervention targets upstream determinants of health.
2. Describe the organizations involved and/or social policies enacted in the implementation of the intervention.
3.Explain whether or not the intervention was/is successful and what lessons public health practitioners can learn from that experience that might improve population health in the United States.
Articles:
Dinca-Panaitescu, S., Dinca-Panaitescu, M., Bryant, T., Daiski, I., Pilkington, B., & Raphael, D. (2011). Diabetes prevalence and income: Results of the Canadian Community Health Survey. Health Policy, 99(2), 116–123.
Retrieved from the Walden Library databases.
Feeny, D., Kaplan, M. S., Huguet, N., & McFarland, B. H. (2010). Comparing population health in the United States and Canada. Population Health Metrics, 8, 8–18.
Retrieved from the Walden Library databases.
Kirkpatrick, S. I., & McIntyre, L. (2009). The Chief Public Health Officer’s report on health inequalities: What are the implications for public health practitioners and researchers? Canadian Journal of Public Health, 100(2), 93–95.
Retrieved from the Walden Library databases.
Vafaei, A., Rosenberg, M. W. & Pickett, W. (2010). Relationships between income inequality and health: A study on rural and urban regions of Canada. Rural and Remote Health, 10(2), 1430.
Retrieved from the Walden Library databases.
Please apply the Application Assignment Rubric when writing the Paper.
I. Paper should demonstrate an excellent understanding of all of the concepts and key points presented in the texts.
II. Paper provides significant detail including multiple relevant examples, evidence from the readings and other sources, and discerning ideas.
III. Paper should be well organized, uses scholarly tone, follows APA style, uses original writing and proper paraphrasing, contains very few or no writing and/or
spelling errors, and is fully consistent with doctoral level writing style.
IV. Paper should be mostly consistent with doctoral level writing style.
SAMPLE ANSWER
Health inequities are avoidable imbalances that contribute to poor health. Solutions for such inequities may be found in upstream interventions that address social, economic and environmental situations. Social determinants include preventative strategies such as physical activity and proper diet as important ways of preventing chronic diseases and improving overall health (Gore & Kothari, 2012). In Canada, Ontario implements interventions aiming to influence environmental and social factors to address inequities in health.
There is increasing prevalence of chronic disease among certain pockets of the Canadian population. Problems associated with the high cost of treating such diseases necessitate efforts to implement interventions targeting their underlying causes. Canada renewed its commitment to public health in 2003 in a response strategy targeted towards addressing Severe Acute Respiratory Syndrome through healthy living interventions. The associated cost of treating chronic diseases threatens the sustainability of the healthcare system. This realization informs the implementation of a healthy living intervention in Canada through development of chronic diseases prevention guidelines (Gore & Kothari, 2012).
In Canada, low economic social status is measured in terms of literacy and income levels. It determines citizens’ vulnerability to cardiovascular disease, diabetes, asthma and chronic obstructive pulmonary disease (Dinca-Panaitescu, Dinca-Panaitescu, Bryant, Daiski, Pilkington, & Raphael, 2011). Studies show higher prevalence of chronic disease and lower life expectancy in low -income areas as compared to wealthier areas. Research also shows that job insecurity, unemployment, part-time employment and temporary employment negatively affects health as it is associated with elevated levels of chronic diseases such as blood pressure and increased risk of death from cardiovascular diseases. Aborigines, immigrants and people of color also have low incomes and are at higher risks of stress that triggers development of chronic diseases (Gore & Kothari, 2012).
Canada implements health policies aimed at preventing chronic illnesses by addressing upstream causes encompassing lifestyle, socioeconomic and environmental factors. One example of the policies is the 2009 Canadian Cardiovascular Society Guidelines advocating for reduced salt and simple sugars intake. It promotes the replacement of saturated and trans-fats with unsaturated, as well as higher consumption of vegetables and fruits. The guideline also recommends greater attention to weight control to prevent obesity and ensure that more citizens maintain a healthy body weight (Raine, 2010).
Health boards received instructions on the appropriate way to evaluate the population needs and tailor interventions to the groups facing the highest risk. Another policy is the Ontario guidelines for healthy eating and active living that informs various interventions to address health inequities in Ontario (Gore & Kothari, 2012). Aboriginal people and new comers in Canada have a higher prevalence of chronic illness often because of poor nutritional decisions and lack of opportunities for physical exercise. To address inequities among aboriginal people, there is an initiative to provide recreation and fitness equipment and youthful fitness ambassadors in their various locations. Other interventions in the Ontario guidelines for healthy eating and active living include provision for a web and phone based dietitian serving populations in remote areas. It also includes providing fruits and vegetables to schools through partnership with the ministry concerned with agriculture. Efforts to encourage physical activity include collaboration with urban planning designers to ensure that cities promote healthy living and that schools have routes that encourage physical exercise through walking and biking. The local public health units also oversee the compulsory programs and 36 heart health community partnerships to reduce cardiovascular disease (Ministry of Health Promotion, 2006).
The Ontario plan on active and healthy living is also referred to as ACTIVE2010 supports communities to implement community sports and physical activity and nutrition projects (Ministry of Health Promotion, 2006). The plan adopted a multi-sectoral approach targeting the population on a variety of levels. It includes actors from NGOs, private industry, service providers, and communities. Partnership between actors in healthcare is imperative in addressing the wide-ranging impact of social determinants in populations residing in diverse settings (Gore & Kothari, 2012).
The government in Ontario supports the intervention through policies that guide enhanced physical activity in schools, providing access to nutritious foods to children and encouraging hygiene and safety in the environment. Community organizations actively participate through facilitating health promotion trainings to prevent the occurrence of chronic illnesses among at risk individuals. Private companies also participate by creating health and wellness programs for their staff including healthier food choices and exercise. Some companies in the food industry are also keen in providing healthier food selection and creating awareness on the same (Ministry of Health Promotion, 2006).
The physical exercise interventions are tenable and have resulted in substantial benefits to the population. The interventions assist Ontarians to become more physically active through community sports and physical activity projects that are largely supported through the communities in action fund. The implementation of the Ontario’s trail strategy also encourages physical activity through provision of outdoor walking spaces in various areas for all (Ministry of Health Promotion, 2006). In as much as interventions targeting to reduce salt content in packaged and restaurant foods are tenable, the dietary recommendations for preventing chronic diseases remain largely unmet in Canada. Only a few companies have positively responded to the guidelines’ recommendations. The industry progress is underwhelming because many other companies are yet to take voluntary measures to reduce salt in their food products. It shows that regulatory controls are necessary to increase the number of companies acting to reduce sodium levels in processed foods (Raine, 2010).
The Canadian Heart and Health strategy and Action Plan recommends that creating heart friendly environments through education, legislation, and policies aimed at promoting healthy eating and physical activity are efficient interventions in addressing upstream determinants of health. An examination of environment-based interventions to prevent cardiovascular diseases in Ontario and indicates that they failed to address the social causes or determinants of illnesses. Interventions in settings at schools, workplaces, government buildings and communities are insufficient in addressing unfavorable living conditions and factors that create inequity. There is need for greater political will to invest more aggressively in prevention to achieve success (Raine, 2010).
Complete success of the Ontario’s healthy eating and active living plan is dependent upon greater political will to support aggressive implementation including legislative measures. Public health practitioners in the United States must ensure that when adopting such interventions, there is a solid legal foundation to ensure success. The US requires implementing strategies that address health inequities emanating from low-income and racial factors are addressed through population specific measures. A multidisciplinary approach is also imperative in ensuring that communities, government agencies and private sector players coordinate their efforts. There must be enforceable laws on wellness programs, food industry parameters and urban planning. These factors coupled with concerted efforts between public health agencies, education, food and agriculture, companies and the communities provide prime conditions for success.
References
Dinca-Panaitescu, S., Dinca-Panaitescu, M., Bryant, T., Daiski, I., Pilkington, B., & Raphael, D. (2011). Diabetes prevalence and income: Results of the Canadian Community Health Survey. Health Policy, 99(2), 116-123.
Gore, D., & Kothari, A. (2012). Social Determinants of Health in Canada: Are Health Initiatives There Yet? A Policy Analysis. Internatinal Journal for Equity in Health, 11(41), 1-14.
Ministry of Health Promotion. (2006). Ontario’s Action Plan for Healthy Eating and Active Living. Retrieved September 24, 2014, from www.mhp.gov.on.ca: http://www.mhp.gov.on.ca/en/heal/actionplan-EN.pdf
Raine, K. D. (2010). Addressing Poor Nutrition to Promote Heart Health: Moving Upstream. Canadian Journal of Cardiology, 21-24.
We can write this or a similar paper for you! Simply fill the order form!
Identify a theory that can be used to support your proposed solution.
Write a summary (250 words) in which you:
Describe the theory and your rationale for selecting the theory.
Discuss how the theory works to support your proposed solution.
Explain how you will incorporate the theory into your project.
SAMPLE ANSWER
Incorporating Theory
Various theorists have developed different theories to help understand the concept of nursing. The theories aim to add value on nursing to promote quality. One of the theories the paper deliberates on and which supports my proposed solution is Virginia Henderson’s Need Theory.
The theory was developed by Virginia Henderson, who defined nursing as the duty to help individuals, either sick or not, to perform various activities that aids their recovery or helps them to a peaceful death (Wills & McEwen, 2002). These are the activities that the individual may not perform without assistance because the one lacks strength, knowledge, and will. This assistance is essential in helping the patient/individuals to gain independence quickly (Afaf, 1997). Therefore, a nurse has the duty to work with the person, provide needed help, and do some roles for the person to achieve independence.
The reason for choosing this theory is that it expounds the roles of a nurse. Nurses must be able to assist the individuals to enhance recovery, as they require attention to make them strong to stand on their own.
This theory works to support the solution through its various assumptions. One of the assumptions is that nurses provide care to patients until they are in a position to care for themselves (Taylor & Lillis, 2001). The second assumption is that nurses have a desire and are willing to devote themselves night and day to provide care for the patients (Delaune & Ladner, 2002). Therefore, these assumptions and the roles that nurse do jointly enhance the quality of care. Patients must be assisted to make them independent to resume to their normalcy.
One of the reasons why I would incorporate the theory in my practice is that it impacts on the health of the patients. Nurses have a role to help their patients in becoming independent. This is a very important aspect in the field of nursing and nurses must always be committed and dedicated to providing better care to their patients.
References
Afaf, M. (1997). Theoretical Nursing: Development & Progress, 3rd ed. Philadelphia, Lippincott.
Delaune, C., & Ladner, K. (2002). Fundamental of nursing, standard and practice, 2nd edition, Thomson, NY.
Taylor, C., & Lillis, C. (2001). The Art & Science Of Nursing Care, 4th ed. Philadelphia, Lippincott.
Wills, M., & McEwen, M. (2002). Theoretical Basis for Nursing Philadelphia. Lippincott Williams & Wilkins.
We can write this or a similar paper for you! Simply fill the order form!