Using only publicly available information, investigate the extent to which Steve Easterbrook, President, and CEO of McDonald’s and McDonald’s organization appear to be fully committed to building, supporting, and nurturing a diverse workforce.
Presenting your findings: Provide a succinct (approximately 500 – 600 word) synopsis of your findings.
SAMPLE ANSWER
McDonalds Organization was formed in 1940 in the United States. It began as a barbecue restaurant operated by Maurice and Richard McDonald. It runs a chain of fast foods restaurant around the world dealing with hamburger. In 1948, it recognized their operations as a hamburger stand that uses production line principles. The growth of the company worldwide was due to the work of Ray Kroc who joined in 1955 as a franchise agent. Ray later bought the company from the McDonalds brothers. The operations of the McDonalds restaurant is either under the corporate itself, a franchisee, or an affiliate. Therefore, the source of income is from the revenues collected from the franchise, the royalties paid, the rent, and also from the sales in the company-operated restaurants.
The organization of the McDonalds organization is a complex structure, whereby it operates fast food restaurants in more than 100 countries. Nurturing of a diverse workforce is, therefore, necessary to facilitate the cultural organization at McDonalds. Steve Easterbrook, the president and CEO at McDonalds, is fully committed to supporting, building and nurturing of a diverse workforce. The organization regards diversity and inclusion as a part of its culture covering from the board to the crew. Steve believes that leaders should hold themselves accountable for respecting and valuing individuals all across the counter within the organization (DuBrin, 2011).
One of the important steps taken by Steve Easterbrook is the step of shifting from awareness to involvement of actions. Instead of just creating awareness, a goal was set such that the workers in the organization can live and explore their full potential thus promoting commitment among the workforce. In promoting responsibility and diversity, Steve has ensured the employment of minority U.S employees and 70% of the population to be women (Burns, 2012). There is a high percentage of women and other minority employees of more than 25% in leadership positions (Devarakonda, 2013).
For the build and support of the McDonald’s brand, Steve Easterbrook has dedicated the company to identifying and developing partnerships with other major organizations. Through the establishment and the maintenance of these organizational partnerships, a brand trust is developed among diverse communities and hence increasing their presence in the various populations. It, therefore, ensures that a customer-friendly environment is created and thus ensuring a diverse workforce. Under their submission, the McDonald’s Company provides that an inclusive environment is created for the employees and the customers on a global basis (Burns, 2012).
Due to the social critics about their high-calorie menu, the McDonald’s company has had to initiate a complete cultural change. It started the training and programs that mentor the restaurant crews thus emphasizing leadership development and also helping the employees to explore their full potential. By training the restaurant team the company became committed in diversification and leadership development. It ranges from the C-suite to the lower ranks at McDonald’s. The diversity included a focus on the supply chain and thus promoting community involvement, external branding, corporate responsibility, and the creation of awareness to the consumers concerning nutrition (DuBrin, 2011).
Through the leadership of Steve Easterbrook, the McDonald’s Company has successfully involved diversification in their operations. Steve has been committed to the building, nurturing, and supporting of a diverse workforce.it is also evident that the McDonald’s Organization is dedicated to providing inclusive works environment, support and facilitating training. It thus indicates that the diversity and inclusion are the fundamental element of the McDonald’s Organizational culture.
References.
Kaplan, M., & Donovan, M. (2013). The inclusion dividend: Why investing in diversity & inclusion pays off. Brookline, MA: Bibliomotion.
DuBrin, A. J. (2011). Leadership: Research findings, practice, and skills. Mason, OH: South-Western Cengage Learning.
Devarakonda, C. (2013). Diversity & inclusion in early childhood: An introduction. London: SAGE.
Burns, J. M. G. (2012). Leadership. New York, NY: Open Road Integrated Media.
Wright, A.-M. (2006). FE lecturer’s guide to diversity and inclusion. London: Continuum.
We can write this or a similar paper for you! Simply fill the order form!
It is important to take note that the writer will be written a synopsis of the company, and the company must be from the U.S
Project Success or Failure
Success or failure in any endeavor is usually determined by numerous factors—some foreseeable and controllable, others not. It’s generally agreed that a good plan, executed well, often results in success. But sometimes, good plans go awry due to sheer happenstance. For example, most sports fans have seen a team’s seemingly brilliant game plan rendered useless by an unfortunate injury to a key player. When that happens, any chance for success is often contingent on the response and leadership of the team’s coaching staff in adjusting the plan.
Similarly, more than a theoretically good plan is needed for projects to be successful. Success or failure often results from the steps taken or not taken by project managers and other key staffers during the course of the plan’s execution. Utilizing your research on factors leading to success and failure of projects, choose a company that is regarded as a model of successful projects in the United States of America. Now, imagine yourself as a project manager for this company.
• Write a brief synopsis of the company, focusing on a particular successful project.
o What specific actions did the leaders take that led to success?
o What qualities did the leaders display that demonstrate a model for what the best project managers do?
• Cite two reasons why this project might have failed if not for the leaders’ management approaches.
o You should reference at least two scholarly resources from your research on causes of project failure.
Resources
Readings
• Cooke-Davies, T. (2007). Project success. In P. W. G. Morris & J. K. Pinto (Eds.), The Wiley guide to project, program & portfolio management (pp. 226–249). Hoboken, NJ: John Wiley & Sons.
In Chapter 10, the author discusses the elements of successful project management, outlining typical criteria for success at three different organizational levels. The chapter, as a whole, sets up a framework for thinking and talking about project success with the objective to advance the art and science of project management.
• Abbas, T. P., & Sanavullah, M. Y. (2008). Chaos: The root cause of project failures. ICFAI Journal of Computer Sciences, 2(2), 66–79.
The authors assert that chaos is inherent in the field of software engineering (SE) despite impressive advancements. The study attempts to identify the major factors that prevent appropriate remedies and points to flawed SE practices as the root cause.
• Flinders, K. (2011, September). Just say ‘no’: How to save your IT project—and career—from failure. Computer Weekly.
SAMPLE ANSWER
A project is regarded a success if all its objectives and goals are realized at the end of the project. The major factor to a successful project is by having a talented project manager. Poor managers lead to project failures. Since a project may be a success or a failure, several factors are involved. For project success, smart people, that is the human resource should be considered first. Proper planning is also a key factor. Other factors include open communication, careful risk management, and secure project closure. On the other hand, there exist several factors that lead to project failures. Some of these are poor planning and hence inefficient ways to track progress, weak leadership, failure to manage and set expectations, and inadequately trained project managers. With these factors considered, a project in a company can be regarded a success or a failure (Barker & Cole, 2012).
Google Incorporation, is a corporation based in the United States of America. Throughout its project operations, it has realized success thanks to the excellent factors put in place. Sergey Brin together with Larry page is known to be the founders of Google. They had an objective of making the world’s information accessible and useful together with the organization of the information. Google Inc. has several projects such as the Google self-driving car project. Its developer is the Google X that aims to provide technology for electric vehicles (Barker & Cole, 2012). These cars are designed to use a software named Google Chauffeur. The project is led by the co-founder of the Google Street View known as Sebastian Thrun.
Leaders from the Google self-driving car project employed several factors to realize its objectives (Camilleri, 2011). Proper planning is a crucial factor in any project management. Plan sets up a project to its success from the start. For the project, during its planning stage, all the stakeholders were on board, and it ensured that all of them got to know the direction of the project. Open communication is another step considered by the project leaders to be an important step in realizing the success of the project. Consideration of outside sources of information is vital. Working under defined schedule is important, and this thus leads to the need for an open communication. The team needs to be well informed about the current programs of the project. Open communication is also considered as a factor that helps prevent the occurrence of problems (DuBrin, 2011).
The qualities of the leaders involved in the Google self-driving car project deployed qualities that led to the success of the project. Good communication a very vital tool that is presented by the leaders. Their ability to communicate to almost every staff in the project vicinity prevented a lot of problems from occurring. Integrity is a good quality that is presented by the leaders involved in the project. The actions carried out by the leaders should be of moral standards. The ability to delegate tasks is an essential element that a project manager must deploy to his subjects. It enables proper specialization and also the right workforce for the correct job within the project. With the presentation of these qualities, the leaders in the project were able to realize success (Camilleri, 2011).
In this project that depends mainly on technology, lack of open communication will have led to several problems encountered in the course of the project. Was it not for the quality of open communication portrayed by the project leaders the project might have failed. The lack of proper planning qualities by the leaders could have led to the failure of the project. It is, therefore, essential for every project to consider proper planning (DuBrin, 2011).
Upon conclusion, the Google Self-driving car project has realized success due to the proper leadership with talented leaders. For any project to achieve its success, management of the project should be the priority since it is critical (DuBrin, 2011). Project success and failures all depend mainly on the management and the qualities of the leaders. Failures are in other cases controllable while others are not even certain.
References.
Barker, S., & Cole, R. (2012). Brilliant project management: What the best project managers know, do and say.
DuBrin, A. J. (2011). Leadership: Research findings, practice, and skills. Mason, OH: South-Western Cengage Learning.
Top of Form
Camilleri, E. (2011). Project success: Critical factors and behaviours. Farnham: Gower Pub.
Bottom of Form
Pather, S., Remenyi, B., & Remenyi, D. (2011). Managing risks of ICT projects. Kidmore End: Academic Publishing.
We can write this or a similar paper for you! Simply fill the order form!
Euthanasia is defined as the intentional administration of drugs that are lethal with the intention of terminating person’s life in a painless manner; to relieve patient from continued suffering from an chronic and incurable condition which that is unbearable. There are three types of euthanasia; a) voluntary euthanasia- which refers to euthanasia conducted upon patient requests; b) Non- voluntary euthanasia- which refers to euthanasia performed but not from patient wish/ request and c) Physician assisted suicide- where the physician willing and knowingly terminates patient life at the patient request (Dierckx de Casterlé, Denier, De Bal & Gastmans, 2010).
Impact on nursing practice, social values, morals, and norms
The advancement in technology and medical knowledge has led to changes in the causes as well as death timing in the modern world. The advancement in technology have made life expectancy to increase; but the longer they live, the more people are subjected to degenerative diseases which are chronic and have gradual health deterioration to old age, who are admitted in the palliative care where they get end of life are. In the diverse healthcare facilities, the physicians and the nurses are part of the interdisciplinary team but the role of the nurses differs from the other healthcare providers. This is because the nurses are closer to their patients, and are often confronted with the mourning and distress from the family members and relatives (Sharp, 2012).
Human euthanasia is legal in few countries including Luxembourg, Belgium, Colombia, Netherlands, Germany, Switzerland and Japan. In the USA, the euthanasia is legal is few states including New Mexico, California, Vermont, Oregon, and Montana (Sharp, 2012).
For example, in nursing profession, there is the issue of trust, i.e. the patient should trust the nurse that he or she will not be killed by the nurse. In this context, euthanasia concepts develop the dimension of suspicion that conflicts with the nurse roles as healer and comforter. On the other hand, the patient expects the nurses to be their advocates, thus, institutions that co-opt euthanasia in their policy could cause the rise of the concept of distrust due to the interrupted confidence in relationship between the service user and the service provider (Quaghebeur, Dierckx de Casterle & Gastmans, 2009).
The integrity of nurses should never be used mainly to meet the patient goals i.e. patient wishes to die. Although utilitarian theory supports this practice, it is against the nurse moral and professional dignity for the nurses. Although involvement of the nurses in executing euthanasia adversely affect the society faith as well as trust in nursing practice; it is in line with the nurses professional responsibility of protecting human dignity, caring and promoting as well as protecting patient interest. Thus it can be said it is compatible with nursing practice (Salladay, 2015).
Ethical theory and principle
The four medical ethical principles impact significantly about the nursing debate about euthanasia. These principles include non-maleficence, autonomy, justice and beneficence. For instance, the nurses are obliged to respect for the patient autonomy. This justifies the issue of euthanasia, as the nursing professional ethics indicates that patient’s autonomy must be respected. The patient request on their private life must be respected by the physician, government and the nurses. Therefore, the nurses must never feel guilty when undertaking these tasks as it is respecting autonomous (Salladay, 2015).
The critics that arise in this context include the fact that these practices have little respect to empathy and autonomy of the patient family and relatives. It is argued that a patient autonomy is not vital if it erases all the importance of the community social paradigm. Life is a valued paradigm in the society. Secondly, it is strange that euthanasia supporters advocate for patient autonomy even when the patient does not enjoy his/her autonomy. Therefore, euthanasia is an indication that the healthcare providers are unable to deal with death, which causes the questioning the quality of autonomy if the patient flees from anxiety or their uncertainty by choosing death. This is a mere defeatist perspective, where there lacks room for positivity or hope in ending the person suffering (Sharp, 2012).
Rejection of euthanasia is mainly supported by the nursing ethics principle of non-maleficence. If this principle is applied, euthanasia is a drastic interventions applied in the end of life care, which makes it difficult to deal in with death correctly. This principle supports the sanctity of life making it difficult to acknowledge euthanasia as ethical practice. Therefore, this principle calls for respect for life. This is also supported by the ethical principle of beneficence delineates the importance of promulgating the legitimate interests of all other people involved. On the other hand, the ethical principle supports in practicing the overall good of the patient, which requires in stating what is medically appropriate for the patient (Quaghebeur, Dierckx de Casterle & Gastmans, 2009).
Additionally, in protecting patient’s request, then, euthanasia is viewed as justice as it illustrates the expression of delivering good care for the patient. Although the consequentialism theory criticizes euthanasia, the ethical principle of justice here implies that the patient needs are addressed to according to their needs or according to their possibilities. Additionally, this principle is likely to be affected by the danger of being self-righteous or self-gratification attributes associated with the new movement- which euthanasia is a part of (Salladay, 2015).
Conclusion
The increased lack of consensus between the nurses on this ethical issue points the importance to analyse the world view and ideologies as well as the nurse’s attitudes and beliefs about euthanasia. Attention should be focused on the role of euthanasia in essence of care by evaluating the evidence based studies. This is especially important because of the specificity nature of the nursing expertise in care, especially in end of life care.
Quaghebeur, T., Dierckx de Casterle, B., & Gastmans, C. (2009). Nursing and Euthanasia: a Review of Argument-Based Ethics Literature. Nursing Ethics, 16(4), 466-486. http://dx.doi.org/10.1177/0969733009104610
Salladay, S. (2015). Ethical Problems. Nursing, 45(2), 14. http://dx.doi.org/10.1097/01.nurse.0000459548.37627.9a
Sharp, R. (2012). The dangers of euthanasia and dementia: how kantian thinking might be used to support non-voluntary euthanasia in cases of extreme dementia. Bioethics, 26(5), 231-235. http://dx.doi.org/10.1111/j.1467-8519.2011.01951.x
We can write this or a similar paper for you! Simply fill the order form!
Prepare a critical analysis of a qualitative study focusing on the problem statement, study purpose, research question, literature review, and theoretical framework. This can be one of the selected articles from your previous literature review or a new peer-reviewed article.
The completed analysis should be 1,000-1,250 words and should connect to your identified practice problem of interest.
Refer to “Research Critique Part 1.” Questions under each heading should be addressed as a narrative, in the structure of a formal paper.
Prepare this assignment according to the APA guidelines found in the APA Style Guide, located in the Student Success Center. An abstract is not required.
This assignment uses a rubric. Please review the rubric prior to beginning the assignment to become familiar with the expectations for successful completion.
You are required to submit this assignment to Turnitin.
NRS433V.v10R.ResearchCritiquePart1Guidelines_student.docx
Please Note: Assignment will not be submitted to the faculty member until the “Submit” button under “Final Submission” is clicked.
SAMPLE ANSWER
The critical appraisal refers to the analysis of the peer reviewed articles done for specific purposes. In nursing, this is mainly done for three main reasons including improving of practice, to broaden the student understanding and nursing knowledge about evidence based practice (Burns & Grove, 2011). During this assessment, the student must put the following into considerations including the study findings and their appropriateness in nursing practice as well as other situation. This helps guide the student on further pilot studies that needs to be conducted to assure effectiveness and safety of the paediatric patients. This is important it facilitates in identification of the potential changes that positively influence of the nursing practice (Maltby, 2010).
To help me in synthesizing these skills that are important in when conducting research in nursing practice, I will critically appraise the following qualitative peer reviewed article Racine, E., Larivière-Bastien, D., Bell, E., Majnemer, A., & Shevell, M. (2012). Respect for autonomy in the healthcare context: observations from a qualitative study of young adults with cerebral palsy. Child: Care, Health and Development, n/a-n/a. doi:10.1111/cch.12018. The article problem statement, purpose of the study, research question and literature view, and conceptual theoretical framework will be critically appraised (De Chesnay, n.d.).
Problem Statement
The aim of the study is to evaluate the healthcare provider’s roles in respecting patients suffering from the cerebral palsy autonomy. This is important because individuals with disabilities in healthcare face diverse ethical and social issues that are very important (Maltby, 2010). This includes communication issues, disparities in accessing the basic services such as routine care or even preventive care as well as the infringement of the patient confidentiality and autonomy. The article describes this is particularly important for these patients because it affects the patient’s cognitive ability (Racine et al., 2012).
The article describes the pre-understanding of the issue and its relevance in paediatric care. Additionally, the article describes holistically the concept of nursing, its practice as well as its importance in respecting patients’ rights and confidentiality when delivering quality care, irrespective of the patient’s health complication, gender, age or ethnic background (Racine et al., 2012). The knowledge gap in this research problem is that transition of paediatric care to adult care in patients with cerebral palsy is complicated, due to the autonomy issues associated with shifts medical decisions to the adolescent (Racine et al., 2012). This is especially a challenge in adolescents diagnosed with cerebral palsy during this transition period. This is because the impairments of the motor and the communication skills that could become conflated with the patients cognitive disability. This is hinders effective delivery of care and increases the costs of treatment (Racine et al., 2012).
Purpose and Research Questions
The purpose and research questions are clearly stated, and the research purpose and research question are related. The research question is ‘what are the perspectives of autonomy for adults diagnosed with cerebral palsy (Racine et al., 2012)?
To answer this research questions, the researcher carried out semi-structured interviews with 14 participants aged between 18-25 years, and those who suffers from cerebral palsy. The researcher also audiotaped the interviews. This study design applied in this type of research is the phenomenological qualitative design. The study sampling technique that is used is the purposive sampling technique (Racine et al., 2012). The data collected was transcribed by verbatim and was analysed using the conventional thematic qualitative content analysis (Burns & Grove, 2011). This sampling approach is important for this type of study, because it facilitates the investigation of the experiences of the young people as well as the healthcare provider’s autonomy. This also facilitates the attainment of the information redundancy. The study reliability and validity was maintained through the use of triangulation. This reduced study bias (Maltby, 2010).
Literature Review
Literature review is summative and conjoined with the introduction. The researcher merely reports other studies findings in a narrative form with no critique However, literature review has information that is adequate enough to construct a logical argument (Burns & Grove, 2011). The literature review summarizes the current knowledge that is relevant to research questions and research purpose i.e. valuing the experiences of in paediatrics diagnosed with cerebral palsy and in ensuring that patient’s autonomy is maintained, especially in children diagnosed with long term and severe infections (Racine et al., 2012). The author has utilized quantitative and qualitative studies that focus on autonomy in paediatric patients diagnosed with cerebral palsy. The references used are current starting from 2006 to 2011. However, the researcher has also used studies from previous studies, older than 5 year which is applied for qualitative studies purposed (Racine et al., 2012).
Conceptual / Theoretical Framework
The author identifies a specific perspective in which the study was established. This is the fact that if the issue of autonomy is contextualised in healthcare, it will improve the quality of care. According to the article, ill adapted health, lack of adequate resources and attitudes towards as well as the increased parental involvement could positively or negatively impact autonomy (Racine et al., 2012). Theoretical framework is not well described, but the author mentions Dynamic Systems Theory (DST), which described the development of the patient’s motor and cognitive functions (Racine et al., 2012). The article describes that the subsystems spontaneously self-organize and interact collectively in a specific manner, which enables identification of the most possible solutions for management of patient’s autonomy. Therefore, the healthcare providers should evaluate and consider all aspects of the theoretical aspects to understand the interaction between various aspects including environments, family and service user (Racine et al., 2012).
Conclusion
This paper helps in improving nursing care especially in paediatric care for chronic conditions. It is vital to identify the gaps in these transitions from paediatric to adult health, which EBP highlights the poor outcomes as well as the diminished opportunities for the service users. More research should be conducted to ensure smooth transitions that will foster autonomy and prepare the young adults transition effectively. This helps improve the lifelong function and establishment of appropriate healthcare services that are uninterruptable during the transition from childhood, adolescence into adulthood.
Reference
Burns, N., & Grove, S. (2011). Understanding Nursing Research (5th ed.). Elsevier. ISBN-13: 9781437707502
De Chesnay, M. (n.d.). Nursing research using historical methods.
Maltby, J. (2010). Research methods for nursing and healthcare. Harlow, England: Pearson Education.
Racine, E., Larivière-Bastien, D., Bell, E., Majnemer, A., & Shevell, M. (2012). Respect for autonomy in the healthcare context: observations from a qualitative study of young adults with cerebral palsy. Child: Care, Health And Development, n/a-n/a. doi:10.1111/cch.12018.
We can write this or a similar paper for you! Simply fill the order form!
Nonparametric Procedures and Chi square Test Order Instructions: Application: SPSS Exercises
Nonparametric Procedures and Chi square Test
Complete the following exercises in your course text Using SPSS for Windows and Macintosh: Analyzing and Understanding Data, by Green and Salkind. Be sure to save your output and export it to your Word document, in which you also must answer the analysis questions and present your results section as indicated:
• Exercises 1–4 on p. 327, Chi-square test (Note: Use “Lesson 40 Exercise File 1.sav”)
• Exercises 1–4 on p. 343, Nonparametric procedures
Exercises 1–5 on p. 354, Nonparametric procedures.
I will send the details for the papers via email.
Nonparametric Procedures and Chi square Test Sample Answer
327, Chi-square test
The hypothesis, in this case, is H0: the two samples are independent, versus, Ha1: the two samples are dependent.
Table 1:
Chi-Square Tests
Value
df
Asymp. Sig. (2-sided)
Pearson Chi-Square
96.000a
4
.000
Likelihood Ratio
80.352
4
.000
Linear-by-Linear Association
.047
1
.828
N of Valid Cases
48
a. 6 cells (66.7%) have expected count less than 5. The minimum expected count is 1.02.
The chi-square critical value at (0.05, 4) = 9.488, the null hypothesis is rejected. Thus, the two samples are dependent.
343, Nonparametric procedures
The Mann-Whitney U-test results are as summarized in Table 1 and Table 2. In this case, the null hypothesis to be tested is H0: The two samples come from the same distribution, versus, Ha1: the two sample do not come from the same distribution.
Table 2:
Test Statisticsa
time (seconds)
Mann-Whitney U
112.500
Wilcoxon W
217.500
Z
-1.974
Asymp. Sig. (2-tailed)
.048
Exact Sig. [2*(1-tailed Sig.)]
.048b
a. Grouping Variable: weight
b. Not corrected for ties.
The p-value is 0.048 since p-value is smaller than the level of significance the null hypothesis is rejected. Thus, the sample population is
The p-value of t-test (assuming the data has equal variance) is 0.37, whereas that of Mann-Whitney U test is 0.048. In t-test, the hypothesis to be tested is H0: The two samples have an equal mean, versus, the Ha1: the two sample population have different mean.
No need to run another test (Post Hoc test), for the difference is insignificant.
Descriptive Statistics
N
Mean
Std. Deviation
Minimum
Maximum
Social Extroversion
18
3.72
2.109
1
10
Hair Color
18
2.00
.840
1
3
d =, where s pooled =
s pooled =
=
=
d =
Thus, the effect size is
One way ANOVA
Table 7:
ANOVA
Hair Color
Sum of Squares
df
Mean Square
F
Sig.
Between Groups
5.300
6
.883
1.450
.280
Within Groups
6.700
11
.609
Total
12.000
17
At 95% level of significant, these results are not statistically significance, since p-value 0.280 is greater than α = 0.05
The results of Kruskal-Wallis and One-way ANOVA results indicate that there is no statistically significant difference between the mean of the variables.
Marking criteria
Maximum marks
a) Relevance of studies/ research papers cited- 3marks
b) Adequacy of studies / research papers cited -2 marks
c) Identification of theories/ concepts- 5 marks
d)Ability to identify key items in the literature: compare contrast-5 marks
e) Critical review of key items- summarise what is known strengths and limitations, gaps in the literature/ theory-10 marks
f) English- grammar, spelling, referencing-5marks
Total= 30
Kindly use the above marking criteria to prepare the literature review. Be sure the literature review is prepared as per marking criteria as this is a very very important assignment.
SAMPLE ANSWER
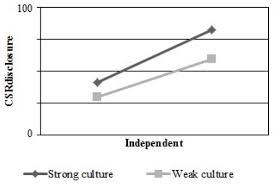
Independent and CSR disclosure relationship
The likelihood of a relationship with real money related torment to get changed evaluators will mostly be lower in case the audit board will be much higher. The exposures propose that the self-principle of the audit driving social occasion of trustees may influence the objectivity and shot of the outside evaluator (Wells & Ingley, 2015). By having the head of overview consultative assembling free of the alliance, the essential accumulation of trustees can enough screen the execution of the connection and result in enhanced corporate execution and exposure. Past studies have shown that review consultative party expects an affecting part in redesigning the corporate association benchmarks. Outline board union is tirelessly identified with budgetary reporting and sponsorship for the relationship between the zone of a review and more showed money related reporting (Haldar & Mishra, 2015). The area of an audit managing get-together was in a general sense and positively related to the level of decided presentation. Audit driving array of trustees expect a gigantic part in giving a mean to the blueprint of the company’s frameworks in term of going on cash related data and its inside control, as necessities be its district is in making first rate budgetary reporting (Davis & Lukomnik, 2013).. The barricade should set an audit board with no under three self-speaking to officials or more. The area of the survey consultative social event with a larger amount of free chief should diminish the workplace cost and upgrade within control that will prompt more unmistakable nature (Valmohammadi, 2014).
Board size and CSR disclosure relationship
The case information contains 54 relationships from sustainability disclosure in a Malaysian Environment as well as the corporate governance reporting. This is in light of the way that just 64 affiliations that consolidated into these two regard in Malaysian open recorded affiliations. Along these lines, this concentrate additionally takes 64 general relationships from the Global Reporting Initiative (Wolf, 2014). The master picks 2011 in light of the way that; that year the latest information open when the examination started. The last blueprints contain 130 affiliations (54 Malaysian Companies and 76 kenya relationship) as the rest were denied for two reasons, to be specific the openness of information and money part. At regardless, there are two affiliations that don’t have the information for the picked period. Second, there are two affiliations which are in the point of interest range (Gulzar & Wang, 2010). These relationships, in the purpose of premium part are banned in connection of the refinements in the bits of their monetary proclamations concerning the non-money divisions (Adiloglu & Vuran, 2012). This is more key to guarantee a high consistency in then study as a matter of fundamental extent. The affiliations consolidate acouple of fundamental extents or business winds, for case, buy things, moved things, exchanging and affiliations, money, progress, properties and lodgings (Sun, Salama, Hussainey & Habbash, 2010).
Significant relations that exist between CEO’S duality and CSR disclosure
The owners of many companies in Malaysia as well as in Kenya under the voluntary exposure and statistically significant in all annual reports that were found from both Malaysia and Kenya. Voluntary disclosure is defined as the shares that accompany is not moved in hands of few and expansive shareholders and prevent other s from having access to it (Galbreath, 2011). Most of the many shareholders are having small portions of the company shares and it is very important for all the companies to employ then use of public accountability due to the fact that they are held accountable to the public at large. Public accountability help in making sure that all the information is made clear and open for all to view all the operations of the company that are taking lace and how their money is spent (Rodrigue, 2014). What the company shareholders have is termed as then ownership concentration that has to be highly considered in making sure that all operations take place as required. The level of corporate governance is guided to ensure that then shareholders property in the company is well protected to then benefit of both then shareholders as well as the company at large (Dragomir, 2013). The voluntary exposures are negatively affected by the government ownership while on the other side the institutional as well as the shareholder ownership done not affect the level of voluntary disclosures (Sanan, 2011).
Significant relationship between CSR disclosure and audit committee
CEO duality
The role of duality is a potential impact on disclosure not common among the listed companies of study and testing has to be well done on it accordingly to give then desired results. All the separate roles that are given to the chair and chief executive are well highlighted to enhance monitoring of quality and decrease all the advantages that are gained when information is withheld (Del Baldo, 2012). The quality if reporting is well improved under such circumstances. All the relationship that exists between the corporate governance is well examined through focusing on disclosure of share of option. When the same person is aid to hold both the CEO and board chairman positions CEO duality is said to exist. A person will get greater power from any company that employs the use of CEO duality (Rahim & Alam, 2014). The shareholder wealth is well maximised where a company employs the use of a better CEO duality in their premises. Monitoring quality of the company will as well be improved and information will not be withheld as it used to be before such implementations were it in place (Porter & Miles, 2013).
Table 1: Statistics of most Malaysian companies. (Source: Rahim & Alam, 2014)
The whole yearly report is inspected before any choice is made with a specific end goal to guarantee that judgements of hugeness is not uneven, which is according to the recommendation and practice (Peters & Romi, 2014). A summary included 39 corporate presentation things covering on five subjects (natural, pro, assembling, thing and quality included) were revealed (Allegrini & Greco, 2013). Correlation analysis can be used to determine the strength and direction of liner relationship (Michelon & Parbonetti, 2012). The table below has given all the correlation report between variables and regression for Malaysian and Kenyan companies (Anuchitworawong, 2010). Some of the variables were found to be more significant, but with negative correlations which is the CSR disclosure Index and ownership concentration (Mishra & Mohanty, 2014).. There was a negative correlation that existed between CSR disclosure Index and ownership concentration while on the other side there proved to be positive relation between role of independent and role of duality (Cormier & Magnan, 2014).
The relationship that exists between the corporate connection trademark, corporate execution and CSR presentation are all around broke down under the usage of three sorts of variables has been analysed in the above section (Okongwu, Morimoto & Lauras, 2013). The self-controlling variables fused the corporate connection trademark, for occasion, board size, board free, some bit of duality, head of overview reprimanding gathering, and proprietorship focus and corporate execution was measured through the use of Return on Asset and Return on Quality (Burnett, Skousen & Wright, 2011).
Corporate social responsibility (CSR) and sensibility reports are constantly snatching vitality exhaustive as stakeholders concerns have connected past standard money related considerations to matters, for example, security and wellbeing moreover the effect of relationship on nature and the get-together (Habib-Uz-Zaman, 2010). The present globalization slant and making eagerness from accessories toward relationship in getting a handle on corporate social obligation (CSR) sharpens have drawn on the relationship of relationship in CSR hones CSR could be a general clarification which could show an association’s devotion to use its exchange related assets out the business sharpens with a particular deciding objective to give and add to its inside and outside partners (Mallin, Michelon & Raggi, 2013). In the prior decade, Malaysia has experienced an immense monetary and social changes that have been of greater use to then whole country and its people in large. Henceforth, the business environment has likewise wound up being all the more bewildering and inquiring. Corporate social obligation has been one of the making issues that in enterprisingly standing up to pushed relationship in Malaysia moreover all around. Corporate social obligation goes about as a part to enhance the affiliations picture (Luu, 2014). The whole prosperity is related to the cash reporting structure, that mirrors the society’s all the more wide yearning for of the bit of the business bunch in the economy. Corporate social obligation that is based in Malaysia ordinarily relates particularly to another organisation named Bursa Malaysisa organizing on recorded affiliations (Ben, 2014). All open recorded affiliations are required to reveal data identifying with their corporate social commitment hones in their affiliations. CSR structure delineated social obligation as an open and coordinate business sharpens, which relies on upon all the important qualities on upon fabulous values and respect for the get-together, doles out, environment, shareholders and contrasting shareholders (Lopatta & Kaspereit, 2014).
Discussion and Conclusion
Outcomes have found the capacity of all the aggregate presentation was just 14.5%, the Malaysian affiliations revealed just 81.2% of the general things in their disclosure instead of the general affiliations which uncovered around 89.7 %. The limit for the earth point was around 14.6%, pack cementing 7.1%, HR 37.5%, and things and affiliations 20.5%. It was nearby set up that The Malaysian affiliations have still addressed, they’re the best introduction for reliably and every one of the affiliations had uncovered their corporate social commitment presentation (Kaya & Aslan, 2013). The most stunning subject uncovered by the Malaysia affiliations was the gathering joining point (92.1 for each penny), trailed by the things and affiliations topic (81.1 for every penny); the earth point (71.1 penny), and the HR subject (63.5 for every penny). For general affiliations, the most lifted point was the social affair commitment subject (91.4 for every penny), trailed by the things and affiliations topic (88.9per penny); the HR subjects (89.7 for each penny) and environment subject (76.4 for each penny). With a specific end goal to find the relationship that existed between the corporate qualities and CSR presentation hypotheses were evident in the study. Results from the specific break conviction examination have shown that three hypotheses were seen taking after to there were administrator relationship between the board size, board free, and proprietorship center with CSR presentation(Kathyayini, Tilt, & Lester, 2012). The present study has shown that the measure of director in the board did thoroughly influence the CSR presentation. As the general affiliations more titanic driving get-together of executives size would make it all the more clear to control the CEO and the watching system would be all the all the all the all the likewise affecting(Harp, Myring and Shortridge, 2014). Sheets with more than seven or eight people were seen to be at danger to be practical, especially for the general affiliations withdrew and the Malaysian affiliations.. In association of the pulling in bits of taking in, the degrees of NED in the Malaysian and general affiliations were seen to be completely exceptional as by a long shot a large portion of the affiliations have no not a level of boss. Right when the level of free, non-official supervisor in the Malaysian and general affiliations were higher, the affiliations expected that would have better results. It was in light of the way that the free boss could perceive a key part in overhauling the corporate picture. Furthermore, the free boss could in like course, go about as an observing part in guaranteeing that the association was genuinely coordinated by its connection. In like manner, proprietorship fixation was found to have an enormous association with the CSR presentation. There were some findings that were collected for both Malaysin companies as well as those in Kenya and demonstrated a higher mean rate as a show of propsperity on proprietorship fixation which was 66.9% showed up, especially in relationship with the general affiliations which was just 32.4%. Both the Malaysian and general affiliations ought to have more concentrate on proprietorship fixation on the grounds that the concentrated possession could give a region to control the work environment issue through the strategy of the alliance and shareholders‟ leisure activities, which in this way has completed an unrivalled corporate execution.
References
Adiloglu, B., PhD., & Vuran, B., PhD. (2012). The relationship between the financial ratios and transparency levels of financial information disclosures within the scope of corporate governance: Evidence from turkey. Journal of Applied Business Research, 28(4), 543-554
Aktas, R., Kayalidere, K., & Kargin, M. (2013). Corporate sustainability reporting and analysis of sustainability reports in turkey. International Journal of Economics and Finance, 5(3), 113-125
Allegrini, M., & Greco, G. (2013). Corporate boards, audit committees and voluntary disclosure: Evidence from italian listed companies. Journal of Management & Governance, 17(1), 187-216
Anuchitworawong, C. (2010). The value of principles-based governance practices and the attenuation of information asymmetry. Asia – Pacific Financial Markets, 17(2), 171-207
Ben, P. J. (2014). Corporate governance index and firm performance. Journal of Contemporary Research in Management, 9(3), 33-44
Burnett, R. D., Skousen, C. J., & Wright, C. J. (2011). Eco-effective management: An empirical link between firm value and corporate sustainability. Accounting and the Public Interest, 11, 1-15
Chan, M. C., Watson, J., & Woodliff, D. (2014). Corporate governance quality and CSR disclosures. Journal of Business Ethics, 125(1), 59-73
Cormier, D., & Magnan, M. (2014). The impact of social responsibility disclosure and governance on financial analysts’ information environment. Corporate Governance, 14(4), 467
Davis, S., & Lukomnik, J. (2013). Social issues come of age in corporate governance. Compliance Week, 10(110), 60-61
Del Baldo, M. (2012). Corporate social responsibility and corporate governance in italian SMEs: The experience of some “spirited businesses”. Journal of Management & Governance, 16(1), 1-36
Dragomir, V. D. (2013). Environmental Performance and Responsible Governance E+M Ekonomie a Management, (1), 33-51
Galbreath, J. (2011). Are there gender-related influences on corporate sustainability? A study of women on boards of directors. Journal of Management and Organization, 17(1), 17-38
Gulzar, M. A., & Wang, Z. (2010). Corporate governance and non-listed family owned businesses: An evidence from pakistan. International Journal of Innovation, Management and Technology, 1(2), 124
Haldar, P. K., & Mishra, L. (2015). The changing facets of corporate governance and corporate social responsibilities in India and their interrelationship. Information Management and Business Review, 7(3), 6-16
Harp, N., Myring, M., & Shortridge, R. T. (2014). Do variations in the strength of corporate governance still matter? A comparison of the pre- and post-regulation environment. Journal of Business Ethics, 122(3), 361-373
Kathyayini, K., Tilt, C. A., & Lester, L. H. (2012). Corporate governance and environmental reporting: An australian study. Corporate Governance, 12(2), 143-163
Kaya, C. T., & Aslan, L., CRMA. (2013). A research on the association between corporate governance and corporate performance in Turkish energy sector. GSTF Business Review (GBR), 3(1), 167-171
Lopatta, K., & Kaspereit, T. (2014). The world capital markets’ perception of sustainability and the impact of the financial crisis. Journal of Business Ethics, 122(3), 475-500
Luu, T. T. (2014). Corporate governance and brand performance. Management Research Review, 37(1), 45-68
Mallin, C., Michelon, G., & Raggi, D. (2013). Monitoring intensity and stakeholders’ orientation: How does governance affect social and environmental disclosure? Journal of Business Ethics, 114(1), 29-43
Md Habib-Uz-Zaman Khan. (2010). The effect of corporate governance elements on corporate social responsibility (CSR) reporting. International Journal of Law and Management, 52(2), 82-109
Michelon, G., & Parbonetti, A. (2012). The effect of corporate governance on sustainability disclosure. Journal of Management & Governance, 16(3), 477-509
Mishra, S., & Mohanty, P. (2014). Corporate governance as a value driver for firm performance: Evidence from india. Corporate Governance, 14(2), 265-280
Okongwu, U., Morimoto, R., & Lauras, M. (2013). The maturity of supply chain sustainability disclosure from a continuous improvement perspective. International Journal of Productivity and Performance Management, 62(8), 827-855
Peters, G. F., & Romi, A. M. (2014). Does the voluntary adoption of corporate governance mechanisms improve environmental risk disclosures? evidence from greenhouse gas emission accounting. Journal of Business Ethics, 125(4), 637-666
Porter, T., & Miles, P. (2013). CSR longevity: Evidence from long-term practices in large corporations. Corporate Reputation Review, 16(4), 313-340
Rahim, M. M., & Alam, S. (2014). Convergence of corporate social responsibility and corporate governance in weak economies: The case of Bangladesh. Journal of Business Ethics, 121(4), 607-620
Rodrigue, M. (2014). Contrasting realities: Corporate environmental disclosure and stakeholder-released information. Accounting, Auditing & Accountability Journal, 27(1), 119-149
Sanan, N. (2011). Corporate governance in public and private sector enterprises: Evidence from india. IUP Journal of Corporate Governance, 10(4), 37-59
Sun, N., Salama, A., Hussainey, K., & Habbash, M. (2010). Corporate environmental disclosure, corporate governance and earnings management. Managerial Auditing Journal, 25(7), 679-700
Valmohammadi, C. (2014). Impact of corporate social responsibility practices on organizational performance: An ISO 26000 perspective. Social Responsibility Journal, 10(3), 455
Wells, P., & Ingley, C. (2015). Interlocking directorships and the corporate-community connection: Evidence from the antipodes. Paper presented at the 523-531
Wolf, J. (2014). The relationship between sustainable supply chain management, stakeholder pressure and corporate sustainability performance. Journal of Business Ethics, 119(3), 317-32
We can write this or a similar paper for you! Simply fill the order form!
I request writers Bonnie or Sasha (Thanks for consideration), Marvin
Excel dataset is the same as previous SLP assignments but I can send again in email once writer contacts me. Thanks, Marvin
Module 5 – SLP
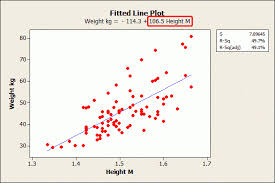
UNIVARIATE VERSUS BIVARIATE ANALYSES; REGRESSION
Interpret the two models that appear below, and address the following additional questions as they pertain to each:
1. What about confounding? Which of the variables are potential confounders?
2. Compare and contrast matching on potential confounders versus including them in a regression model.
BMI (1 unit) = 1.3 + 2.4 (diabetes) + 2.3 (family history diabetes) + 1.7 (gender) + 1.4 (age) + 1.7 (race) + 2.6 (income) + 3.4 (height), p<0.05
Allergies = 4.5 + 3.8 (Family History Allergies) + 2.1 (gender) + 1.4 (age) + 0.8 (race) + 1.5 (weight), p<0.05
SLP Assignment Expectations
Length: SLP assignments should be at least 2 pages (500 words) in length.
References: At least two references must be included from academic sources (e.g. peer-reviewed journal articles). Required readings are included. Quoted material should not exceed 10% of the total paper (since the focus of these assignments is critical thinking). Use your own words and build on the ideas of others. When material is copied verbatim from external sources, it MUST be enclosed in quotes. The references should be cited within the text and also listed at the end of the assignment in the References section (APA format recommended).
Organization: Subheadings should be used to organize your paper according to question
Format: APA format is recommended for this assignment. See Syllabus page for more information on APA format.
Grammar and Spelling: While no points are deducted for minor errors, assignments are expected to adhere to standards guidelines of grammar, spelling, punctuation, and sentence syntax. Points may be deducted if grammar and spelling impact clarity.
The following items will be assessed in particular:
• Achievement of learning outcomes for SLP assignment.
• Relevance—all content is connected to the question.
• Precision—specific question is addressed; statements, facts, and statistics are specific and accurate.
• Depth of discussion—points that lead to deeper issues are presented and integrated.
• Breadth—multiple perspectives and references, multiple issues/factors considered/
• Evidence—points are well-supported with facts, statistics, and references.
• Logic—presented discussion makes sense; conclusions are logically supported by premises, statements, or factual information.
• Clarity—writing is concise, understandable, and contains sufficient detail or examples.
• Objectivity—use of first person and subjective bias are avoided.
Privacy Policy | Contact
Module 5 – Home
UNIVARIATE VERSUS BIVARIATE ANALYSES; REGRESSION
Modular Learning Outcomes
Upon successful completion of this module, the student will be able to satisfy the following outcomes:
• Case
o Distinguish between univariate and multivariate analysis.
o Distinguish between dependent and independent variables.
o Distinguish between logistic and linear regression.
• SLP
o Interpret the results of a regression analysis, both linear and logistic
o Discuss the concept of confounding, and note potential confounders in a hypothetical study.
o Assess the merits of matching on confounders versus adjusting for confounders by including them in a regression model.
• Discussion
o Identify confounders for known diseases.
Module Overview
Univariate versus Multivariate Analysis
Univariate analysis looks at how two variables relate to one another. Often time, it examines whether there is an association between a potential risk factor or background characteristic (e.g. smoking, gender, exercise) with an outcome or disease (e.g. lung cancer, breast cancer, diabetes). The analysis only involves the disease (or outcome) with the potential risk factor (or exposure). Multivariate analysis, on the other hand, examines more than one potential risk factor at the same time, and their potential association to the disease or outcome. For instance, one could examine the effects of smoking, gender, age, obesity, and diabetes together against a potential association with cardiovascular disease.
National Science Digital Library’s Computation Science Education Research Desk: Univariate Data and Bivariate Data. Retrieved from http://www.shodor.org/interactivate/discussions/UnivariateBivariate/
National Science Digital Library’s Computation Science Education Research Desk: Graphing and Interpreting Bivariate Data. Retrieved from http://www.shodor.org/interactivate/discussions/GraphingData/
Dependent versus Independent Variables
In these cases, the outcome or disease status is the dependent variable, whereas any potential exposure or risk factor is an independent variable. Multivariate analysis most often looks at one dependent variable (disease or outcome status) and more than one independent variable (e.g. gender, race, income, medical history, etc.).
Collier, W. Independent & Dependent Variables. University of North Carolina at Pembroke. Retrieved from http://www.uncp.edu/home/collierw/ivdv.htm
Confounder
A confounder is a variable that is linked with a disease (or outcome) and is related with the risk factor (or exposure), that changes the relationship between the exposure and outcome. For instance, let’s say that obesity is a potential risk factor for diabetes. Then consider a third variable, a family history of diabetes, that is also a potential risk factor for diabetes, and is related to obesity. If the addition of the third variable (family history of diabetes) changes the relationship between obesity and diabetes, then the third variable (family history of diabetes) is a confounder in this situation.
Resources
PowerPoint Presentation Regarding How to Control for Confounding: https://www.google.com/url?sa=t&rct=j&q=&esrc=s&source=web&cd=2&cad=rja&ved=0CDkQFjAB&url=http%3A%2F%2Fcphp.sph.unc.edu%2Ffocus%2Fvol4%2Fissue1%2F4-1AdvancedData_slides.ppt&ei=6jkFUq-nMYjw2QWrjYHIBA&usg=AFQjCNEx5DfK5SDgjc_kyaMo1uFkl8zQIA&sig2=887k52Cs6-jotuMeo0iDJQ&bvm=bv.50500085,d.b2I
University of Pennsylvania. Stratification and Matching in Design. Retrieved from http://www.cceb.upenn.edu/pages/localio/EPI521/2007/part4.pdf
Penn State. STAT507 Epidemiological Research Methods: 3.5 – Bias, Confounding, and Effect Modification. Retrieved from https://onlinecourses.science.psu.edu/stat507/node/34
Health Knowledge. Confounding, interactions, methods for assessment of effect modification. Retrieved from http://www.healthknowledge.org.uk/public-health-textbook/research-methods/1a-epidemiology/confounding-interactions-methods
Logistical and Linear Regression
Unlike univariate analysis, regression models allow researchers to examine more than one independent variable at a time against a dependent variable. This means that confounders or demographic variables may be studied alongside the exposure and outcome variables, to adjust for any potential bias that may arise due to background characteristics (e.g. difference by gender or race or income, etc.). Depending on the outcome variable, logistical regression is used for binary outcomes (e.g. disease status of “yes” or “no,” mortality data, etc.) whereas linear regression is used for continuous outcomes (e.g. blood pressure, bone mass density, fasting blood glucose, etc.). Logistical and Linear models can be interpreted as follows:
Lung Cancer = 4.5 + 2.4 (smoking) + 1.7 (gender) + 2.3 (age) + 0.7 (race), p<0.05
After controlling for gender, age, and race, those with a history of smoking are 2.4 times more likely to have lung cancer than those who do not smoke (p<0.05). In this statement, lung cancer is the dependent variable, history of smoking is the independent variable of interest (the exposure), and gender, age, and race are the confounders. This is a logistical regression model, where the dependent variable is binary: lung cancer versus no lung cancer.
BMI (1 unit) = 3.9 + 3.4 (high fasting glucose) + 1.5 (gender) + 1.3 (age) + 2.7 (race), p<0.05
After controlling for gender, age, and race, a one unit increase in BMI is 3.4 times more likely in those with a high fasting glucose level than those with a lower fasting glucose level. In a linear regression model, the dependent variable is continuous and results are measured in units. The dependent variable here is body mass index (BMI) and the independent variable is fasting glucose levels (high versus low), and the potential confounders are gender, age, and race.
Additional Resources
Lowry, Richard. Simple Logistical Regression. VassarStats: Website for Statistical Computation.http://www.vassarstats.net/logreg1.html
Ludford, Pamela J. University of Minnesota, College of Science and Engineering. Linear Regression. Retrieved from http://www-users.cs.umn.edu/~ludford/Stat_Guide/Linear_Regression.htm
McDonald, John H. Logistic Regression. Handbook of Biological Statistics. Retrieved from http://udel.edu/~mcdonald/statlogistic.html
Privacy Policy | Contact
SAMPLE ANSWER
Introduction
Both univariate and bivariate or multivariate analyses are used in determining the relationship between two or more variables (Arsham, 2012; Chatterjee, 2012). For instance, in univariate analysis the relationship between two variables i.e. an independent variable against a dependent variable is examined, whereas bivariate and multivariate analysis the analysis between one dependent variable and two or more that two independent variables respectively is examined in what is known as multiple linear or logistical regression model (Babbie, 2009; Warne, Ramos & Ritter, 2012). In the regression models considered in this assignment, the disease status or outcome is the dependent variable, while the potential risk factors or exposures are the independent variables.
Interpretation of Regression Models
Unlike in univariate analysis, logistical and linear regression models allow the examination of more than one independent variable at once against a dependent variable (Arsham, 2012). In the logistical and linear regression models considered in this case or scenario, the disease status or outcome is the dependent variable, while the potential risk factors or exposures are the independent variables (Chatterjee, 2012). Thus, since the logistical and linear regression models represent multivariate analysis, the relationship between examined is between one dependent variable (outcome status or disease) and more than one or multiple independent variables (e.g. age, gender, race, weight, height, medical/family history, income, etc.). Interpretation of the models is as follows:
After controlling for family history diabetes, gender, age, race, income, and height, a BMI’s increase in one unit is 2.4 times more likely in those with diabetes than those without diabetes. Considering that in a linear regression model, the measurement of the dependent variable results is done in units and also it is continuous. For instance, in this regression model the body mass index (BMI) is the dependent variable and the independent variable is diabetes (presence versus absence), and the potential confounders are family history diabetes, gender, age, race, income, and height.
After controlling for gender, age, race and weight, those with a family history allergies are 3.8 times more likely to have allergies than those without family history allergies (p<0.05). In this statement, allergies is the dependent variable (the outcome or disease), whereas family history allergies is the independent variable of interest (the risk factor or exposure), and gender, age, race, and weight are the confounders. As a result, it means this regression model is a logistical regression model, in which the representation of the dependent variable is form of a binary data i.e. allergies versus no allergies.
Questions
Confounding in Regression Models
Confounding is the presence of variables linked with an outcome (or disease) and related with the exposure (or risk factor) in a regression model, that changes how the exposure relates to the outcome (Chatterjee, 2012; Chvatal, 2013). For example, in model 1 the potential confounders are family history diabetes, gender, age, race, income, and height, while in model 2 the potential confounders are gender, age, race, and weight.
Comparing and contrasting the matching on potential confounders versus their inclusion in a regression model
Potential confounders changes how the exposure relate to the outcome in a regression model. For instance, before controlling for potential confounders (matching) in model 1, a BMI’s increase in one unit is 1.3 times more likely in those with diabetes than those without diabetes but after controlling for potential confounders (inclusion in regression model) a BMI’s increase in one unit increased to 2.4 times more likely in those with diabetes than those without diabetes. In model 2 before controlling for potential confounders (matching), those with a family history allergies are 4.5 times more likely to have allergies than those without family history allergies (p<0.05) but after controlling for potential confounders (inclusion in regression model) the likelihood of those with a family history allergies to have allergies than those without family history allergies dropped to 3.8 times (p<0.05).
References
Arsham, H. (2012). Foundation of Linear Programming: A Managerial Perspective from Solving System of Inequalities to Software Implementation, International Journal of Strategic Decision Sciences, 3(3), 40-60.
Babbie, E. R. (2009). The Practice of Social Research, (12th ed.). New York, NY: Wadsworth Publishing.
Chatterjee, S. (2012). Regression analysis by example. Hoboken, NJ: John Wiley & Sons Inc.
Chvatal, V. (2013). Linear Programming. New York, NY: W. H. Freeman and Company.
Warne, R. L., Ramos, T., & Ritter, N. (2012). Statistical Methods Used in Gifted Education Journals, 2006–2010. Gifted Child Quarterly, 56(3), 134–149.
We can write this or a similar paper for you! Simply fill the order form!
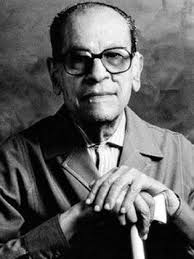
Do you think that Mahfouz wants his readers to believe that Zaabalawi is a real person? Does he want us to think that the narrator of the story believes that Zaabalawi is a real person? Whatever your opinion, explain your reasons for it.
Use your own words.
SAMPLE ANSWER
Zaabalawi by Mahfouz has the qualities of both the traditional stories told in mystical traditions as well as those of modern stories. Mahfouz’s father believed that Zaabalawi was a saint of God who removed worries and troubles. Author’s father friend also believed that Zaalabawi is a miraculous person. Characters portrayed in the story believed that Zaabalawi was a mysterious person and that he exhibited powerful magic. When people were in trouble, they would just have to look for him, and they would be healed and counseled.
Mahfouz’s does not want his readers to believe that Zaabalawi is a real person. The author gives him many traits as spoken by the characters that have had contact with him. The author portrays Zaalabawi as a mystery that and also as someone who possesses every good quality that a real person can not have. No one knows of the whereabouts of Zaabalawi except at the bar where he can be found at specific evenings. Gods possess a variety of characters that make people worship them and also look for them for peace of mind and advice. The author characterizes Zaabalawi as a God, and it is for people to look for him though he can’t be found physically. Zaabalawi helps everyone in need irrespective of where they come from which is a characteristic of gods. Hence, it is evident that the author wanted readers to look beyond the physical being and believe in supernatural powers exhibited by gods and that by engaging with the gods, one can receive healing.
Also, the narrator of the story believes that Zaabalawi exists still he does not quench his thirst of trying to find him. The narrator and all who seek Zaabalawi tend to obtain wisdom and blessings. When they find him, they find inner peace within themselves as well as joy in their hearts. The narrator believes he is real though he is also ambiguous as he resides in people’s mind in the form of the spirit of peace. He continuously looks for him because he does not have peace with himself and wants to connect with Zaabalawi. He only exists in people’s minds and only see him when he is drunk. He is as God. No one has seen God, but everyone believes that he exists.
Every cultural society believes in their God and he has universal characteristics since he is said to be a god of hope, peace, healing, and all things that make people satisfied. Since Zaabalawi is characterized as a God, the narrator believes that he is real, but he has never seen him or touch him.
Though God already exists in the story and that Zaalabawi is like a saint who serves under him, Zaabalawi is still supernatural and has powers to heal people and bring them peace. That’s why everyone who spoke of him gave differing opinions that still characterized a god. He has not been found by the narrator, and he is still in search of him but still believes that he will not find him. Everyone seeks greater divine power to for guidance and peace. Zaabalawi is that power that people seek and talk about when they have a connection with him which is not physical. Zaabalawi is real but virtual. He exists in the minds of those who go to seek him for divine interventions.
Reference
Naguib Mahfouz (1963). Zaalabawi
We can write this or a similar paper for you! Simply fill the order form!
It is important for the writer to note that this paper is a combination of order #113631, 113672, 113741, 113768. The writer will have to combine the solutions that where giving in the above orders and will also include what is added here below in a well-structured APA paper including all what is mention here below. The previous analysis mentioned here below is contain in the solutions of the above mention order.
In order to widely disseminate or publish your research findings, they must be presented in a manner that facilitates comprehension by the educated reader. This week, you will present the findings from the analyses you conducted on your chosen data from Week 3.
Your submission should include your previous analyses and interpretation, along with appropriate sections to address the limitations of your work and opportunities for further inquiry. Follow APA format to present your findings as a paper, including a title page, abstract, introduction, sections in the main body as needed, conclusions, references, and appendices as needed
I will email the dataset that has to be use for this paper as it has also been use for the past 7 weeks for previous assignment.
SAMPLE ANSWER
This paper seeks to compile all the analysis that was performed to determine the safety of people at different working stations. In particular, the paper will bring together all the analytical techniques employed on the data and make the inference about the population parameters. The fundamental of this paper thus is to answer the question whether there exists a difference in injury rate in a different working site, when different genders supervise employees, when workers have worked on a different number of hours, and when a site has a different number of workers (O’Leary, 2013). The analysis will give an insight of the safety of workers, which is vital for firms like the insurance company, and also for policy planning of the company.
The research formatting will utilize the APA writing style, and the analysis will be performed using SPSS for Windows. Nevertheless, the research will seek to infer about the following hypothesis:
H0: There is no significance difference in injury rate at a working site and supervisor’s gender, number of employees and the number of hours at work.
H1a: There is a significance difference in injury rate at a working site and supervisor’s gender, number of employees and the number of hours at work.
It is important to notice that the research hypothesis and research question are intertwined (Creswell, 2013).
Results
Data distribution was evaluated using descriptive measures, which are tabulated in Table 1.
Table 1:
Descriptive Statistics
number of employees
number of hours at work
supervisors gender
injury rate
safety climate
N
Valid
51
51
51
51
51
Missing
0
0
0
0
0
Mean
24.02
49960.78
.47
15.1755
4.6971
Std. Error of Mean
1.050
2183.070
.071
2.44692
.14493
Median
23.00
47840.00
.00
9.1600
4.7600
Std. Deviation
7.495
15590.236
.504
17.47447
1.03497
Variance
56.180
243055455.373
.254
305.357
1.071
Skewness
.056
.056
.121
2.046
.101
Std. Error of Skewness
.333
.333
.333
.333
.333
Kurtosis
.506
.506
-2.068
4.309
-.697
Std. Error of Kurtosis
.656
.656
.656
.656
.656
Minimum
5
10400
0
.00
2.50
Maximum
45
93600
1
76.92
6.80
The descriptive statistics, results show that on average there are 24 workers at each site with a minimum of five workers and a maximum of 45. Notably, the skewedness of the number of workers is close to zero, thus, the normal plot of this parameter will be almost asymmetrical. On average the workers work for 49960.78 hours, with a minimum of 10400 hours and a maximum of 93600 hours. Similarly, the distribution of the number of working hours in almost asymmetric, which is deduced from a low skewness coefficient (Ho, & Carol, 2015).
On average, the injury rate of all the working site is 15.1755, which the minimum of zero injury rate and a maximum of 76.92. Further, the injury rate has a positive skewedness, which means that its standard normal curve will have a long tail to the left (on the higher values of the injury rate) (Ho, & Carol, 2015). Furthermore, these four working sites have on average 4.6971 safety climate, with the safest site having 2.50 safety climate and not safest site have a 6.8 safety climate.
To compare the sample mean, an ANOVA technique was applied, and the results were as follows:
Table 2:
ANOVA
Sum of Squares
df
Mean Square
F
Sig.
safety climate
Between Groups
34.210
33
1.037
.911
.605
Within Groups
19.348
17
1.138
Total
53.558
50
supervisors gender
Between Groups
7.973
33
.242
.868
.648
Within Groups
4.733
17
.278
Total
12.706
50
number of hours at work
Between Groups
9791279435.294
33
296705437.433
2.136
.050
Within Groups
2361493333.333
17
138911372.549
Total
12152772768.627
50
number of employees
Between Groups
2263.147
33
68.580
2.136
.050
Within Groups
545.833
17
32.108
Total
2808.980
50
site
Between Groups
18.655
33
.565
.724
.792
Within Groups
13.267
17
.780
Total
31.922
50
In this case, the injury rate was used as a factor. The decision rule is to reject the null hypothesis when the P-value < level of significance. The p-values show that we will fail to reject the null hypothesis, following the critical rule. Thus, we infer that there is no significance difference in injury rate at a working site and supervisor’s gender, a number of employees and the number of hours at work (Murphy, et al. 2014).
A paired t-test was also performed in an attempt to evaluate the difference in the variables mean. The results were as illustrated in Table 3. Notably, the assumption (null hypothesis) is that the mean of the paired variable is equal, versus, the alternative that the mean of paired variables is not equal (Murphy, et al. 2014).
Table 3:
Paired Samples Test
Paired Differences
t
df
Sig. (2-tailed)
Mean
Std. Deviation
Std. Error Mean
95% Confidence Interval of the Difference
Lower
Upper
Pair 1
injury rate – number of employees
-8.84412
22.98329
3.21830
-15.30827
-2.37996
-2.748
50
.008
Pair 2
injury rate – supervisors gender
14.70490
17.52681
2.45424
9.77541
19.63440
5.992
50
.000
Pair 3
injury rate – safety climate
10.47843
17.51818
2.45304
5.55136
15.40550
4.272
50
.000
Pair 4
injury rate – number of hours at work
-49945.60882
15601.36168
2184.62760
-54333.56251
-45557.65514
-22.862
50
.000
In this case, the rejection rule is: reject null hypothesis if |t calculated| > t tabulated = 1.684. In that light, all the t calculated values are greater than 1.684, and thus, conclusively we say that the paired variables means are not equal.
To find a linear model that can be used to predict injury rate using safety climate, number of hours at work, supervisors’ gender as the predictors in the model
Table 4:
Coefficientsa
Model
Unstandardized Coefficients
Standardized Coefficients
t
Sig.
B
Std. Error
Beta
1
(Constant)
42.248
10.767
3.924
.000
number of hours at work
-.001
.000
-.678
-5.774
.000
supervisors gender
3.564
4.194
.103
.850
.400
safety climate
1.958
2.007
.116
.976
.334
a. Dependent Variable: injury rate
The model is:
Injury rate = 42.248 – 0.001* (number of hours at work) + 3.564*(supervisors gender) + 1.958*(safety climate)
The regression model summary is as given in 5.
Table 5:
Model Summary
Model
R
R Square
Adjusted R Square
Std. Error of the Estimate
1
.649a
.421
.384
13.71976
a. Predictors: (Constant), safety climate, number of hours at work, supervisors gender
The coefficient of determination shows that the fitted model can explain 38.4% of the variation (Lowry, 2014).
Correlations
site
number of employees
injury rate
safety climate
number of hours at work
Site
Pearson Correlation
1
Sig. (2-tailed)
N
51
number of employees
Pearson Correlation
.130
1
Sig. (2-tailed)
.363
N
51
51
injury rate
Pearson Correlation
-.074
-.636**
1
Sig. (2-tailed)
.606
.000
N
51
51
51
safety climate
Pearson Correlation
.331*
.147
-.013
1
Sig. (2-tailed)
.018
.303
.930
N
51
51
51
51
number of hours at work
Pearson Correlation
.130
1.000**
-.636**
.147
1
Sig. (2-tailed)
.363
0.000
.000
.303
N
51
51
51
51
51
*. Correlation is significant at the 0.05 level (2-tailed).
**. Correlation is significant at the 0.01 level (2-tailed).
Notably, there exists a perfect correlation between the number of hours at work and the number of employees, this implies that is the number of workers in a site changes that will be the same proportional change in the number of working hours (Wilcox, 2012). Also, there is a significant negative correlation between injury rate and a number of working hours, and the number of workers in a site at the 95% level of significance. This means that when the number of working hours or the number of employees increases, there will be a decline in injury rate (Wilcox, 2012).
Conclusion
The paper has compiled all the analysis performed previously, discussion of the results were given and inference made. Thus, the primary objective was achieved, on the other hand, the results indicated that there was no adequate evidence to reject the null hypothesis. For this reason, a conclusion was made that there is no significance difference in injury rate at a working site and supervisor’s gender, number of employees and the number of hours at work.
References
Creswell, J. W. (2013). Research design: Qualitative, quantitative, and mixed methods approach. Sage publications.
Ho, A. D., & Carol, C. Y. (2015). Descriptive Statistics for Modern Test Score Distributions Skewness, Kurtosis, Discreteness, and Ceiling Effects. Educational and Psychological Measurement, 75(3), 365-388.
Lowry, R. (2014). Concepts and applications of inferential statistics.
Murphy, K. R., Myors, B., & Wolach, A. (2014). Statistical power analysis: A simple and general model for traditional and modern hypothesis tests. Routledge.
O’Leary, Z. (2013). The essential guide to doing your research project. Sage.
Wilcox, R. R. (2012). Introduction to robust estimation and hypothesis testing. Academic Press.
We can write this or a similar paper for you! Simply fill the order form!
• A manager at a small organization is interested in determining the impact of the recent company outing to Camp Feel-Good on job satisfaction. She would like to compare those who attended and completed the individual and team building exercises during the weekend event to those who did not attend, without making any assumptions regarding which group will have higher job satisfaction. A job satisfaction survey is administered 1 month after the event to 40 employees (20 who attended and 20 who did not attend). The survey is a 10 item Liker scale measure (scale: 1=”Very Dissatisfied” to 5=”Very Satisfied”) with a range of total scores from 10-50, where the higher the score, the greater the level of job satisfaction.
SAMPLE ANSWER
Research statistic
The small organization’s manager wanted to determine the effects the company outing to the Camp Feel-Good had on job satisfaction. Some people attended and completed some team building and individual exercises as the weekend event was going on, while others never attended. The two groups were compared in the absence of assumptions about the group likely to have the highest job satisfaction. Forty employees engaged in this research, where half had attended while the other half had not. A likert scale measure with ten items was during and the total score was to be ten to fifty, where a higher score meant a greater job satisfaction level (Conference Board, 2013).
Definitely, the twenty employees who participated in the outing are likely to report higher job satisfaction levels using the likert scale. This is based on the fact that the employees in a company are among the most vital assets. Therefore, managing them appropriately can make them happy and productive. In the first place, the outing is an indication of organizational support, recognition as vital components of the company, and using the likert scale after the outing is an indication that the company wants to get feedback from the employees. These are vital aspects that make the employees highly motivated (Conference Board, 2013). The outing would also need the employees to be flexible as most are conducted during work days, and this indicates that the management believes in the employees. In addition, an outing is a good way for the life-work balance, which highly motivates the employees (Conference Board, 2013). Attending the event is also a good opportunity for the employees to socialize and converse with the colleagues they might not have interacted with, which promotes the positive, intended impact on employee job satisfaction.
Reference
Conference Board. (2013). Determinants of Job Satisfaction. New York: The Conference Board, Inc.
We can write this or a similar paper for you! Simply fill the order form!