Complete Income Statement
It is time to build the formulas needed to complete the income statement. Begin working on the Income Statement worksheet and complete formulas for all of the cells marked in gray.
Enter the formula to calculate the Condo Rentals Revenue in C13 Multiple the Quantity of Condo Rental Days * the Price for Condo Rental.
Enter the formula to calculate the Ski Lift Revenue in C14 Multiple the Quantity of Ski Lift Tickets * the Price for Ski Lift Tickets.
Enter the formula to calculate the Winter X Games Revenue in C17 Multiple the Quantity of X Games Tickets * the Price for X Games Tickets.
Enter the formula to calculate the Total Revenues in C20 and Total Expenses in C34.
Make sure the cell references for Total Revenues and Total Expenses are placed in cells C37 and C38 respectively.
Enter the formula to calculate the Net Income in cell C39.
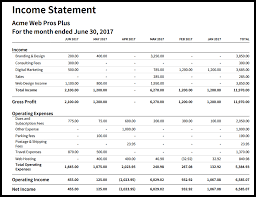
Apply professional formatting to all of this data using the image below as a guide.
Income Statement
Step 2: Build the One-Variable Data Tables
Now that the Income Statement is complete, begin to address the questions about the condo rentals and ski lift tickets.
Build a one-variable data table based on condo rental days. The initial values for Revenue and Net Income for cells I6 and I7 should be cell references from the income statement.
Build a one-variable data table based on the quantity of ski lift tickets. The initial values for Revenue and Net Income for cells I14 and I15 should be cell references from the income statement.
Apply conditional formatting to highlight Net Income of at least $250,000 for each of the one-variable data tables.
In cell G17, a question exists. “If management has a target net income of at least $250,000, which of the above SPECIFIC scenarios in the condo rentals or ski tickets one-variable data table would you recommend using? Explain your reasoning.” Make sure you place your answer in the text box beginning in cell G20.
Apply professional formatting to all of this data using the image below as a guide.
One-Variable Data Tables
Step 3: Build the Two-Variable Data Table
Once the one-variable data tables are complete, begin to address the questions about the X Games tickets sold.
Build a two-variable data table based on the quantity and price of the X Games tickets sold. Enter a reference to Net Income in cell I27 from the income statement.
Apply conditional formatting to highlight Net Income of at least $250,000 for each of the two-variable data table.
In cell G37, a question exists. “If management has a target net income of at least $250,000. Which of the above SPECIFIC combinations of price and quantity of X Games Tickets in the two-variable data table would you recommend using? Explain your reasoning.”
Make sure you place your answer in the text box beginning in cell G40.
Apply professional formatting to all of this data using the image below as a guide.
Two-Variable Data Table
Step 4: Create the Scenario Summary
You addressed quite a few questions. Now it is time to create a Scenario Summary.
Assign names to all of the income statement cell values in column C in the assumptions, revenues, expenses, and summary sections using the labels in column B. For example, select cells B5:C10, and then on the Formula tab in the Defined Names Group, select “Create from Selection” and use the left column as the name (repeat on lower sections).
Build three scenarios by changing cells C8, C15, C16, C29, and C30 using the following data: Optimistic, Mid-range, and Pessimistic.
Scenario Details
Generate the Scenario Summary using C37:C39 as the result cells.
Move the Scenario Summary sheet after the Income Statement and apply professional formatting to all of this data using the image below as a guide.
Completed Scenarios
Step 5: Create Pivot Tables From Warming Hut Data
Select the Warming Hut Sales Worksheet. You notice the data are not formatted or organized well.
Use the Warming Hut Sales data to build Pivot Tables.
Build the first Pivot Table to summarize total sales by category and by location. Name this sheet Pivot Table 1.
Build the second Pivot Table to summarize total sales by category and by season for only the Summit View location. Name this sheet Pivot Table 2.
Build the third Pivot Table to summarize total sales by month and by product for only the Mogul Hill location. Name this sheet Pivot Table 3.
Choose one of the created Pivot Tables and add a professional chart to the same worksheet. Make sure you explain the chart and what it shows in your Documentation sheet.
Apply professional formatting to all of this data using the image below as a guide. Click Image to Expand
Step 6: Create a Documentation Sheet
Clean up the formatting of your Excel workbook, taking into account professional appearance.
The Minimum Requirement (per the Grading Rubric)
Insert a new spreadsheet into the workbook. The documentation sheet should be the first sheet in the workbook.
Make certain all contents of the workbook are properly noted on the documentation sheet. For the sheet with chart, add an explanation of the chart you selected and what this chart shows.
Make certain each tab has a descriptive name for each tab (sheet) in the workbook.
Create the professional documentation worksheet. Be sure to include a description of each worksheet. An image is provided below.Click Image to Expand
Transcript
Finish and Submit
Save your Excel file. Make sure you are aware as to where your files are physically saved. Saving your file often is good practice (Ctrl + s).
Your Excel file should contain seven worksheets.
Documentation Page
Income Statement
Scenario Summary
Warming Hut Sales
Pivot Table 1
Pivot Table 2
Pivot Table 3
Submit one workbook. When submitting the workbook, provide a comment in the comments area explaining what you learned from completing this lab activity. File naming convention: If your name is Jane Doe, then your file should be named very similar to Doe_J_Week6_Lab.xlsx.
We can write this or a similar paper for you! Simply fill the order form!