Interpret the Correlation in the Context of the Data Using Excel graph a scatterplot of the data. (4p)
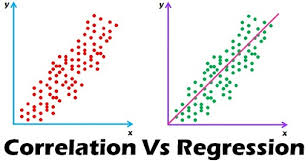
Describe the type of correlation and interpret the correlation in the context of the data. Be specific in describing the magnitude, direction, and strength of the relationship.
Calculate the sample correlation coefficient for the data. (Pearson correlation coefficient between hours spent studying, x, and test score, y). (Round your final answer to three decimal places). (7p)
Show all work and outputs in excel as well as on each question. Can be typed on word docs. The excel scatter plot must include all the outputs. All directions and questions are included in the attachment below.
Interpret the Correlation in the Context of the Data
DIRECTIONS: Make sure your responses are neat and readable. You must show me your calculation in a separate piece of paper. Homework that is difficult to grade due to messiness will be returned ungraded. If you would like to get full credit, do not forget to attach the Excel output.
The number of hours 9 students spent studying for a test and their scores on that test is represented in the table below.
Hours spent
studying, x
0 2 4 5 5 5 6 7 8
Test scores, y 40 51 64 69 73 75 93 90 95
1) Using Excel graph a scatterplot of the data. (4p)
2) Describe the type of correlation and interpret the correlation in the context of the data. Be
specific in describing the magnitude, direction, and strength of the relationship. (6p)
Interpret the Correlation in the Context of the Data
3) Calculate the sample correlation coefficient for the data. (Pearson correlation coefficient
between hours spent studying, x, and test score, y). (Round your final answer to three decimal places). (7p)
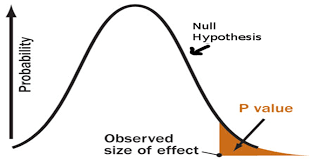
4) Write out the null and alternative hypotheses and conduct a hypothesis testing for the data. At the 5% level of significance, is your test statistic statistically significant? Briefly explain how you reached your conclusion.
For this question you must state followings: degrees of freedom, one or two-tailed hypothesis testing, the critical value, test statistic, do you reject or fail to reject the null hypothesis. (19p)
5) Find the equation of the regression line for the hours spent studying and test scores of students. Compute the a (intercept) and b(slope) values of the regression formula, Y = a + bX for predicting test scores variable from hours spent studying variable. Write the formula replacing a and b by their respective numerical values (round off each element in the final formula to three decimal places). (13p)
6) What is the predicted test score for a student who spent 3 hours studying for the test?
We can write this or a similar paper for you! Simply fill the order form!