Physical Geography Using Google Maps 1. Using Google Maps™, pan your map to (36.184907, -116.932074) coordinates. Zoom out from this area some and by looking at the aerial image of this region, what desert landform makes up the darker colors as seen on the alluvial fan?
Physical Geography Using Google Maps
2. Continuing with your analysis of the area located in Question 1, what do the linear markings on the faces of the fans represent? 3. Still continuing with your analysis of the alluvial fan in Google Maps™, follow the fan up to the edge of the mountain. Does it appear that erosion or deposition has been more prominent at the top of the fan? Explain your reasoning. 4. Zooming out on your Google Maps™ location, does it appear that the alluvial fans in the area are creating a bajada? 5. Finishing your analysis in Google Maps™, suggest a reason as to why the sizes of alluvial fans in the region vary in size. 6. Using Google Maps™, pan your map to (36.612983, -117.112311) coordinates. Zoom out from this area some and by looking at the aerial image of this region, what kind of sand dunes appear to be most common in this dune field? Explain your answer. 7. From which direction does the prevailing wind blow for the sand dunes identified in Question 7 and which way will the sand dunes continue to progress? 8. Using Google Maps™, pan your map to (36.461101, -117.459586) coordinates. Zoom out from this area some and by looking at the aerial image of this region, what kind of sand dunes appear to be most common in this dune field? Explain your answer. 9.From which direction does the prevailing wind blow for the sand dunes identified in Question 8 and which way will the sand dunes continue to progress?
When Wegener proposed his hypothesis of continental drift, little was known about the ocean floor. He thought that the continents plowed through the ocean floor like ice breaking ships plowing through ice. Later studies of the oceans provided one of the keys to the plate tectonic theory. In this lab, you will observe how the magnetic rocks on the ocean floor can be used to understand plate tectonics.
Problem How are the paleomagnetic patterns on the ocean floor used to determine the rate of sea-floor spreading?
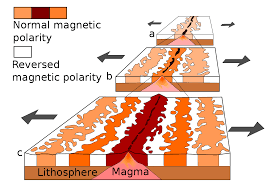
Scientists have reconstructed Earth’s magnetic polarity reversals over the past several million years. A record of these reversals is shown above. Periods of normal polarity, when a compass would have pointed north as it does today, are shown in color. Periods of reverse polarity are shown in white. Record the number of times Earth’s magnetic field has had reversed polarity in the last 4 million years.
The three diagrams on the next page illustrate the magnetic polarity reversals across sections of the mid-ocean ridges in the Pacific, South Atlantic, and North Atlantic oceans. Periods of normal polarity are shown in color and match the colors in the illustration above. Observe that the patterns of polarity in the rock match on either side of the ridge for each ocean basin.
On the photocopy of the three ocean-floor diagrams, identify and mark the periods of normal polarity with the letters a–f. Begin at the rift valley and label along both sides of each ridge. (Hint: The left side of the South Atlantic has already been done and can act as a guide.)
Using the South Atlantic as an example, label the beginning of the normal polarity period c, “2 million years ago,” on the left sides of the Pacific and North Atlantic diagrams.
Using the distance scale shown with the ocean floor diagrams, determine which ocean basin has spread the greatest distance during the last 2 million years. (Measure from the center of the rift valley.)
Refer to the distance scale. Notice that the left side of the South Atlantic basin has spread approximately 39 kilometers from the center of the rift valley in 2 million years.
Analyze and Conclude
Analyzing Data How many kilometers has the left side of the Pacific basin spread in 2 million years?
Analyzing Data How many kilometers has the left side of the North Atlantic basin spread in 2 million years?
Inferring How many kilometers has each ocean basin opened in the past 2 million years?
Calculating If both the distance that each ocean basin has opened and the time it took to open that distance are known, the rate of sea-floor spreading can be calculated. Determine the rate of sea-floor spreading for the South Atlantic Ocean basin in centimeters per year. (Hint: To determine the rate of spreading in centimeters per year for each ocean basin, first convert the distance from kilometers to centimeters and then divide this distance by the time, 2 million years.)
Calculating Determine the rate of sea-floor spreading for the North Atlantic and Pacific Ocean basins.
Drawing Conclusions Which ocean basin is spreading the fastest? The slowest?
Inferring Do ocean basins spread uniformly over the entire basin? Explain.
Use the library or the Internet to research the spreading rates for other divergent plate boundaries on Earth. Where is the fastest spreading rate? The slowest spreading rate?
We can write this or a similar paper for you! Simply fill the order form!
Compensation Strategies Geographic Pay 1) Compensation Strategies Using The Fortune 500 List, identify one company that uses Lowest-Cost Strategy and one company that uses Differentiation Strategy.
Compensation Strategies Geographic Pay
Explain how these strategies work and why these particular companies use them. Do not use any of the companies given as examples in the textbook or used by another student. 2) Geographic Pay The Coca-Cola Company, currently based in Atlanta, GA, is relocating their headquarters to your city (or the city nearest to you). In doing so, Coke hopes to convince many of their current Atlanta-based employees to relocate to your city. What are some considerations that Coke should make for their employees regarding geographic pay differentials between Atlanta and your city? How can Coke persuade their employees to move with the company? Consider the factors mentioned in chapter 2, as well as the CNN Money cost of living calculator.
Write a short essay, three pages, 1.5 spaced (points may be deducted for essays longer than three pages) that clearly states where you stand on the issue of possible human-caused global warming due to greenhouse gas emissions. Make sure you read and follow all the instructions provided on this assignment page before writing your paper.
Choose one of the issues/questions listed below. Your argument should be incorporated into a concise and well-written essay, not randomly discussed. You will need to use a minimum of five reliable sources to support your argument.
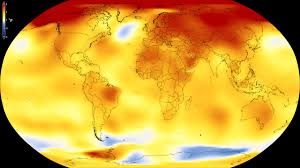
1. What do you make of the measured rise in global average temperatures since 1980? Do you believe the temperature increase is a direct consequence of increased greenhouse gases or natural processes?
I would like you to try to consider the recent measured rise in global average temperature with respect to longer time scale estimates of changes in global average temperature constructed from both measured and proxy records (sea-floor sediments and ice-core studies).
2. How, if at all, does this uncertainty about the effects of increased greenhouse gases on climate change influence your views about global warming and what should be done?
Currently, we are unable to say for sure how much, if any, of the recent warming of global average temperature is due to increased greenhouse gases. We are also unable to predict precisely how climate will change in the future if we continue to add greenhouse gases to the atmosphere. For the most part we rely on computer models, global climate models, to address these uncertainties.
While these models are good tools, the complexity of the climate system and our limited understanding of climate processes make it impossible for climate models to provide reliable answers or predictions.
Of course, your opinions cannot be wrong, but you must clearly state the reasons for your position and use your references to support your argument.
Your grade will be largely based on two items in the grading rubric used for your papers:
(1) Completeness & Discussion (content i.e., did you include everything covered in the instructions?) 50 marks
(2) Mechanics/Grammar & Organization (written communication, i.e., how well is your essay is written?) 50 marks
Your position should be clearly stated. The arguments or reasons that you give in support of your position should be clear and concise. You should concentrate on ideas that shape your opinion. Please do not provide both sides of each issue that you discuss. Discuss what you personally believe and why you believe it, not why someone else may disagree with you.
We can write this or a similar paper for you! Simply fill the order form!
Focus Paper 4: The Scientific Revolution in Social and Geographical Context
In 6-8 pages (or 1500-2000 words), answer the following question, drawing evidence for your argument from one or more of the readings, as appropriate.
The last several readings (including but not limited to Pyenson and Pyenson) have all located early modern science in some wider context or set of contexts: political, social, economic, cultural, colonial, religious, and so on. Picking one or more of these readings, discuss how looking at science in these kinds of contexts might effect our understanding of “where” the Scientific Revolution happened.
You may use other primary or secondary readings from the syllabus. APA Style and citation guidelines are in the syllabus.
We can write this or a similar paper for you! Simply fill the order form!
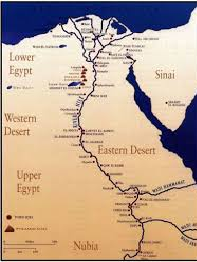
Influence of Geography in Egypt Civilization Explain how geography influenced civilization in Egypt, Assyria, Sumer, and Greece.
Influence of Geography in Egypt Civilization
Explain five reasons for the decline of the Greek city-states. In your eyes, which was the most advanced civilization discussed in the first three chapters, which was the least advanced? Support your response. Just short Essays for each. Begin a discussion by asking pupils to identify some of the basic necessities of life (i.e.: what they require from their environment on a fundamental level to ensure survival), such as food, water, and shelter. Then discuss how the natural resources and landscape of a place can affect whether or not people settle there. Can people grow food there? Is there an adequate and sustainable water source?
Since World War II, the United States has often been placed No. 1 in world rankings of various kinds. With the fall of the Soviet Union in 1991, the United States was often referred to as the sole remaining superpower. As the twenty-first century proceeds, however, the position of the United States at the top of the rankings is being questioned.
What considerations, measures, and weightings do you think should be used in devising such rankings?
Use your method to devise two rankings of the top three political states for:
1) a century of your choice before the twentiethcentury (1800’s or before)
2) the likely ranking by the end of the twenty-first century (2000’s)
Instructions for preparing your paper:
(1) The first paragraph should be an introduction with a thesis statement that directly answers the question.
(2) The middle paragraphs should make up the body. Each paragraph should have a topic sentence and at least five detail sentences. Include interesting and informative supporting facts and examples in your own words to demonstrate a full understanding of the topic and support your thesis. Include documented personal experience from a primary source.
(3) The final paragraph should summarize your research and applications as they relate to your thesis in your conclusion.
Your paper (essay) must:
Use APA formatting in 12-point Times New Roman font, one-inch margins, double-spaced
Include parenthetical in-text citations
At least one of your sources must be a primary source
Be formal in tone. Do not use personal pronouns (I, me, you, etc.) or contractions
Include your name at the top page of your document or create an APA title page
We can write this or a similar paper for you! Simply fill the order form!
Continental Drift Influences Biogeography 1. Explain what BIOGEOGRAPHY is.
2. Explain how DRIFT influences BIOGEOGRAPHY.
Continental Drift Influences Biogeography
3. Explain how EVOLUTION and ADAPTATION affect BIOGEOGRAPHY. Why do different species occur in the places they do? Biogeography is the study of why animal species (and also plants) live in different regions on Earth. This includes both organisms alive today as well as those that have become extinct. Any particular animal species is found where it is because that species either evolved and originated there or came there from some other place. The two divisions of biogeography reflect these two ways that animals come to occupy an area.
Locating an Epicenter and Earthquake from Seismographs To locate an epicenter, records from three different seismographs are needed. Ideally, this activity should be done using a globe.
Locating an Epicenter and Earthquake from Seismographs
When projected onto a flat map, the circles showing distances to the epicenter become distorted. For this reason, the method used here is an approximation.
Problem how can you determine the location of an earthquake’s epicentre?
Materials
• Pencil
• drawing compass
• World map or atlas
• Photocopy of map on page 241
Skills Measuring, Interpreting Maps, Interpreting Graphs
Procedure
1. These three seismograms recorded the same earthquake, in New York City, Seattle, and Mexico City. Use the travel-time graph to determine the distance that each station is from the epicenter. Record your answers in a data table like the one shown.
2. Refer to a world map or atlas for the locations of the three seismic stations. Place a small dot showing the location of each of the three stations on the photocopy of the map on the next page. Neatly label each city on the map.
3. On the map, use a drawing compass to draw a circle around each of the three stations. The radius of the circle, in miles, should be equal to each station’s distance from the epicenter. Use the scale on the map to set the distance on the drawing compass for each station. CAUTION: Use care when handling the drawing compass.
Locating an Epicenter and Earthquake from Seismographs Analyze and Conclude
1. Using Graphs How far from the epicenter are the three cities located?
2. Calculating what would the distances from the epicenter to the cities be in kilometers?
3. Interpreting Maps what is the approximate latitude and longitude of the epicenter of the earthquake that was recorded by the three stations?
4. Drawing Conclusions on the New York seismogram the first P wave was recorded at 9:01 UTC. UTC is the international standard on which most countries base their time. At what time (UTC) did the earthquake actually occur? Explain.
Go Further Use the Internet or the library to find the locations of recent earthquake epicenters. Make a data table displaying the location, date, and magnitude of ten recent earthquakes. Report your findings to the class.